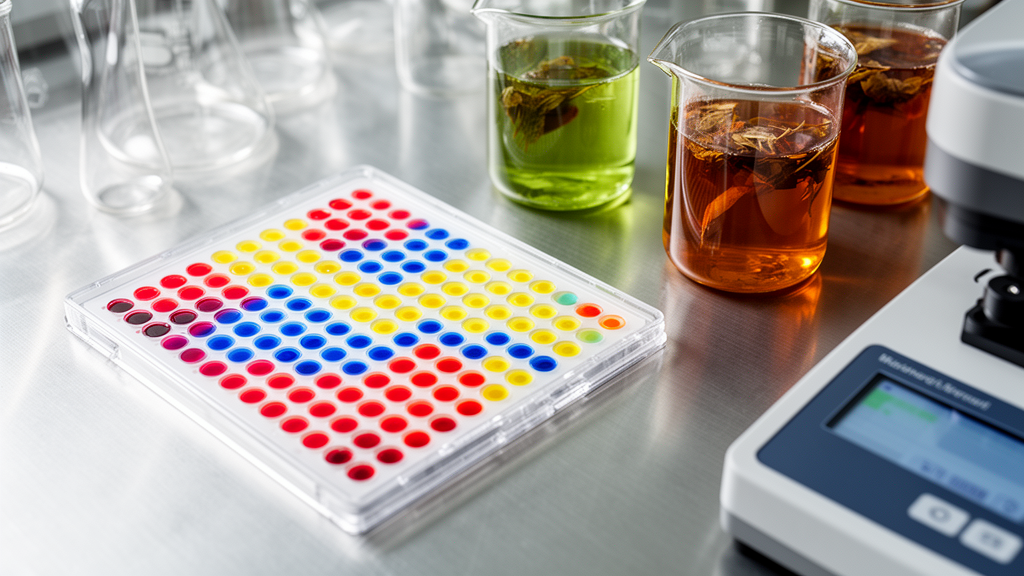
Analytical chemists have engineered a colorimetric sensor array paired with machine learning algorithms that simultaneously classifies tea varieties and quantifies the key antioxidant epigallocatechin gallate, known as EGCG, across complex beverage mixtures. The diagnostic platform, developed by researchers in food chemistry, overcomes a longstanding challenge in agricultural screening where structurally identical polyphenol compounds typically trigger overlapping optical signals that confuse conventional sensor assays. By exploiting dynamic covalent recognition chemistry rather than non-specific physical adsorption, the newly designed testing array generates distinct multidimensional optical fingerprints that allow automated classification models to discriminate subtle molecular differences between closely related catechins and fermented tea matrices.
Tea stands among the most widely consumed beverages globally, carrying substantial commercial value and health-promoting interest that researchers attribute to its rich profile of bioactive polyphenols. Within this chemical family, EGCG serves as the most abundant and representative catechin, recognized across biological literature for its antioxidant, anti-inflammatory, metabolic regulatory, and cardioprotective activities. Consequently, establishing dependable and rapid analytical strategies capable of performing both precise EGCG quantification and reliable tea origin and variety authentication is essential for agricultural quality control and market standardization. Traditional analytical standards rely on high-performance liquid chromatography and mass spectrometry, which yield high quantitative precision but require expensive equipment, tedious extraction workflows, and prolonged operational runs that hinder rapid on-site screening.
To establish a faster and more affordable alternative, investigators have increasingly explored colorimetric sensing arrays that record visible color shifts across chemical indicator libraries. However, classical colorimetric arrays have historically faced severe technical limitations when applied to real plant infusions. Conventional arrays predominantly depend on non-specific hydrophobic interactions or physical surface adsorption, leading to severe optical response overlap and false-positive readouts when structural analogues such as epicatechin gallate, or ECG, coexist in the extract. Furthermore, common colorimetric protocols often compress complex, multidimensional color shifts into a single scalar color-difference value, discarding granular, channel-specific red, green, and blue data and severely limiting quantitative accuracy. Most earlier sensor platforms also separated pattern classification from quantitative chemical estimation rather than combining both functions into one unified workflow.
The research team resolved these operational hurdles by implementing dynamic covalent recognition chemistry founded on phenylboronic acid receptors. Boronic acids possess the specialized ability to bind reversibly to cis-diol functional groups on target organic molecules, forming cyclic boronate esters. This covalent binding equilibrium remains sensitive to molecular geometry, local pH, chemical substituent effects, and competitive binding dynamics. By pre-incubating phenylboronic acid receptors with colorimetric indicator dyes, the scientists assembled receptor-dye complexes that display baseline optical profiles. When an analyte containing multiple cis-diol groups enters the solution, it competitively displaces the indicator dye from the boronic acid receptor, generating a distinct and immediate optical shift that translates molecular recognition events into readable colorimetric signals.
To construct the sensing platform, the investigators systematically screened an extensive combinatorial library comprising thirteen commercially available dye indicators and eleven phenylboronic acid receptors carrying distinct chemical substituents. The screening evaluated dyes such as Alizarin Red S, Pyrocatechol Violet, and Cresol Red alongside receptor derivatives including 3-nitrophenylboronic acid, 2-chlorophenylboronic acid, and fluorinated phenylboronic acids. From this matrix, the team rationally identified nine complementary sensing channel pairs that produced strong, diverse color differences without redundant responses: Alizarin Red S paired with four distinct boronic acid derivatives, Pyrocatechol Violet paired with 3-nitrophenylboronic acid, Alizarin Complexone paired with two receptors, and Cresol Red paired with two receptors. Because each channel provides three distinct color coordinates across red, green, and blue channels, the nine-well configuration yields a 27-dimensional optical feature dataset for every evaluated sample.
Experimental optimization revealed that maintaining a pH of 8.0 in HEPES buffer generated the maximum colorimetric response magnitude, as this environment optimizes the ionization state of the boronic acid groups to promote stable cyclic boronate ester formation with cis-diol motifs while preventing alkaline destabilization. The team also determined an optimal 1:2 indicator-to-receptor molar ratio, which significantly outperformed alternative formulations. Thermal evaluations conducted between 20 degrees Celsius and 60 degrees Celsius revealed no statistically significant variation in color-difference values, confirming that the dynamic covalent sensor platform exhibits robust thermal stability across ordinary ambient conditions and functions reliably at a standard room temperature of 25 degrees Celsius.
To provide mechanistic validation for the displacement phenomenon, the authors performed density functional theory calculations alongside ultraviolet-visible absorption spectroscopy and Benesi-Hildebrand binding constant analyses. Quantum-chemical calculations indicated that the formation of EGCG-receptor complexes was thermodynamically more favorable, displaying lower Gibbs free energy changes than the corresponding indicator-receptor complexes. Spectroscopic monitoring of representative channels confirmed the disruption of initial dye-receptor pairings and the emergence of EGCG-receptor complexes upon analyte addition. In the representative Alizarin Red S and 3-nitrophenylboronic acid channel, the apparent binary binding constant for EGCG with the receptor reached 2.7382 multiplied by 10 to the fourth inverse molar, surpassing the dye-receptor binding constant of 1.7062 multiplied by 10 to the fourth inverse molar and demonstrating that EGCG effectively displaces the pre-bound indicator dye.
The discrimination power of the 27-dimensional sensing array was initially evaluated using eleven representative tea components, including major catechins such as EGCG, ECG, epigallocatechin, and epicatechin, along with gallic acid and common matrix interferents such as ascorbic acid, theanine, and sugars. Linear discriminant analysis successfully grouped the eleven compounds into separated clusters, capturing over 90 percent of the total variance across the first two discriminant factors and producing an overall classification accuracy of 90.91 percent, which was verified through hierarchical cluster analysis. Channel ablation experiments underscored the necessity of the complete configuration: when the array was reduced to four or six channels, classification accuracy fell to 81.80 percent and 79.55 percent, respectively, with ECG repeatedly misclassified as EGCG due to the loss of complementary optical features.
The system was subsequently deployed to analyze authentic agricultural samples encompassing the six major categories of Chinese tea: unfermented green, slightly fermented white, lightly fermented yellow, semi-fermented oolong, fully fermented black, and post-fermented dark tea, representing twenty distinct commercial products. Using a standardized smartphone imaging box equipped with fixed exposure settings and ImageJ color extraction, the array captured optical fingerprints reflecting processing-induced polyphenol transformations, such as the enzymatic oxidation of monomeric catechins into theaflavins and thearubigins. Supervised Random Forest classification achieved 90.0 percent accuracy across the six broad categories, while cultivar-level classifications reached 88.9 percent for green tea varieties, 97.2 percent for yellow tea varieties, and 100 percent for black tea varieties on reserved testing data.
For quantitative assessment, machine learning regression models were trained on 891 experimental records using the full 27-dimensional feature matrix rather than univariate color-difference scalars, which proved incapable of resolving EGCG from ECG. Gradient-boosted trees via XGBoost delivered the highest predictive accuracy on an independent held-out test set of 179 samples, achieving a coefficient of determination of 0.993, a root mean square error of 5.56 micromolar, and a mean absolute error of 3.36 micromolar, closely matching five-fold cross-validation benchmarks. In spike-recovery tests across mixed catechin solutions and real tea infusions, EGCG recoveries ranged from 98.4 percent to 111.7 percent. Comparative testing against high-performance liquid chromatography using dietary supplement tablets and tea matrices yielded no statistically significant difference in recovery precision, establishing the array as a viable, interference-resistant method for rapid quality screening.
Beyond multivariate modeling, the researchers established the baseline analytical sensitivity of the sensor array through univariate color-difference calculations across an epigallocatechin gallate concentration range of 0.3 micromolar to 5 millimolar. This univariate calibration resolved into two distinct linear intervals, spanning 0.0003 to 1 millimolar with a determination coefficient of 0.991 and 1 to 5 millimolar with a determination coefficient of 0.979. Calculated under standard blank variance criteria, the sensor array achieved a limit of detection of 0.09 micromolar and a limit of quantification of 0.31 micromolar. Across the 27-dimensional feature space, comparative evaluation of alternative machine learning architectures confirmed high predictive precision on the held-out test dataset, where support vector regression produced a determination coefficient of 0.993 and a root mean square error of 5.64 micromolar, while back-propagation neural networks and random forest regression attained determination coefficients of 0.988 and 0.983, respectively.
To further examine the competitive displacement equilibrium, the authors estimated an apparent binding constant of 3.2542 multiplied by 10 to the third inverse molar for the ternary system comprising Alizarin Red S, 3-nitrophenylboronic acid, and epigallocatechin gallate. Targeted interference assays demonstrated that the array maintained stable quantification when target molecules were paired in three-to-one ratios with coexisting catechins, yielding recoveries of 103.7 percent for epigallocatechin, 112.6 percent for epicatechin gallate, and 100.4 percent for epicatechin. In a four-component mixture simulating complex tea matrices at a six-to-one-to-one-to-one ratio, target recovery stood at 110.9 percent with a relative standard deviation of 3.4 percent.
Despite its promise for low-cost on-site screening, the authors noted that optical sensor readouts remain susceptible to variations in ambient lighting and mobile camera hardware. Establishing standardized dark-box imaging conditions and cross-device calibration protocols will therefore be essential to translate the platform into routine agricultural and dietary supplement testing.
Subject of Research: Machine learning-assisted colorimetric sensor array for tea discrimination and EGCG quantification
Article Title: Machine learning-assisted boronic acid colorimetric indicator displacement array for dual-functional tea fingerprinting and interference-resistant EGCG quantification
Article References: Ni, Y., Fan, K., Song, P., Dong, X., Lou, C., Guo, M., Deng, Q., Wang, X., & Wei, D. (2026). Machine learning-assisted boronic acid colorimetric indicator displacement array for dual-functional tea fingerprinting and interference-resistant EGCG quantification. Food Chemistry: X, 40, Article 104778. https://doi.org/10.1016/j.fochx.2026.104778
Image Credits: AI Generated
DOI: 10.1016/j.fochx.2026.104778
Keywords: analytical chemistry, colorimetric sensor array, machine learning, epigallocatechin gallate, tea fingerprinting, phenylboronic acid, indicator displacement assay, linear discriminant analysis, random forest classification, xgboost regression, food quality control, density functional theory, catechin discrimination, optical sensing, smartphone imaging, food chemistry
News Source: Teresa Odom. (November 15, 2026). Color Sensor Array and Machine Learning Classify Tea and Measure Antioxidant Levels. Scienmag.