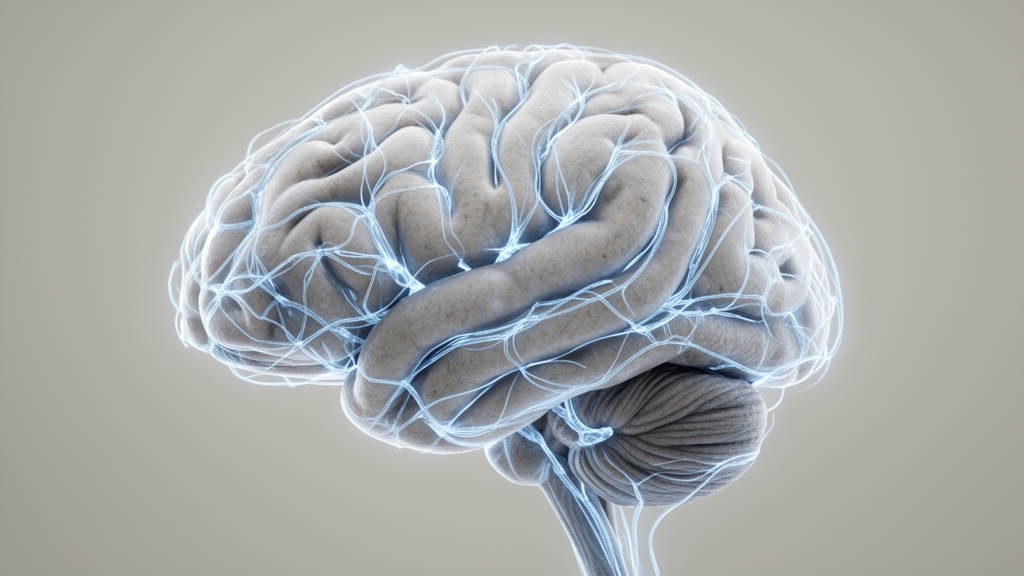
A retrospective cross-sectional neuroimaging investigation has revealed that regional reductions in brain gray matter volume among adults with type 2 diabetes mellitus exhibit spatial correspondence with the organization of the human connectome, while demonstrating that several core structural observations are highly sensitive to coexisting hypertension. Published in Frontiers in Medicine by a clinical research team from Fuzhou, China, the study evaluated structural magnetic resonance imaging data from 49 participants diagnosed with type 2 diabetes and 50 healthy control participants to determine whether observed volume reductions across the brain follow organized architectural patterns or manifest as isolated local deficits. The researchers integrated cortical and subcortical parcellations with normative functional and structural connectivity templates derived from the Human Connectome Project, mapping both group-level structural associations and interindividual heterogeneity within an exploratory network framework.
Type 2 diabetes mellitus is an established chronic metabolic disorder whose systemic sequelae include central nervous system alterations, accelerated brain aging features, and mild cognitive decrements. In this cohort, individuals diagnosed with type 2 diabetes exhibited a median disease duration of 10.00 years, an average glycated hemoglobin level of 9.03 percent, and a median fasting blood glucose of 8.00 millimoles per liter, contrasting with 5.22 millimoles per liter among healthy controls. Furthermore, standardized assessments using the Mini-Mental State Examination identified lower scores among participants with diabetes, recording a median of 27.00 compared to 29.00 in the healthy comparison group. Although prior neuroimaging studies have documented regional volumetric reductions in diabetic populations, conventional regional comparisons have historically lacked the analytical framework to determine whether distributed volumetric changes relate systematically to underlying structural and functional brain wiring.
To rigorously evaluate brain morphology, high-resolution three-dimensional T1-weighted structural scans acquired on a 3.0-Tesla MRI scanner were processed anew using FreeSurfer and the standardized Enhancing NeuroImaging Genetics through Meta-Analysis workflow. The primary parcellation scheme utilized the Schaefer atlas to measure gray matter volume across 400 cortical parcels alongside 14 subcortical structures comprising twelve subcortical gray matter regions and bilateral hippocampi. In the primary statistical models, linear regressions adjusted for participant age, biological sex, and total intracranial volume, applying false discovery rate corrections across all 414 brain regions to control for multiple testing. To account for intrinsic spatial autocorrelation that can inflate statistical significance in spatial neuroimaging comparisons, the authors implemented rigorous spatial permutation testing, running ensembles of 10,000 spherical spin rotations for cortical surfaces and unrestricted label shuffles for subcortical structures.
The primary group-level comparisons identified statistically significant gray matter volume reductions in five distinct brain structures among participants with type 2 diabetes relative to healthy controls. Specifically, significant volume reductions survived false discovery rate correction in parcel 2 of the right visual network, parcel 5 of the right somatomotor network, frontal opercular-insular parcel 7 of the right salience and ventral attention network, and bilaterally within the thalami. Subcortical volume reductions were marked in both the left thalamus, with a t-statistic of negative 3.922, and the right thalamus, with a t-statistic of negative 4.406. No additional cortical parcels or subcortical nuclei met the corrected significance threshold, establishing that structural volume differences in this cohort were distributed across multiple distinct functional systems and deep subcortical processing hubs rather than restricted to traditional memory-associated structures.
To explore how these morphological alterations relate to healthy brain wiring, the investigators derived normative functional connectivity and structural connectivity matrices from 207 unrelated healthy adults in the Human Connectome Project. The team computed connectivity-weighted neighborhood scores, which scale the sum of neighboring group-difference statistics by the count of positive connections across both cortical and subcortical regions. Across cortical parcels, regional gray matter volume statistics displayed a statistically significant positive spatial correlation with normative structural connectivity-weighted neighborhood scores, yielding a correlation coefficient of 0.54. This relationship indicates that cortical parcels exhibiting greater volumetric differences tend to be anatomically connected to neighbors that also show pronounced alterations. In contrast, cortical associations with functional connectivity neighborhoods were not significant, whereas subcortical structures displayed the inverse pattern, demonstrating a significant positive relationship with functional neighborhood scores but not structural neighborhoods.
The investigation further examined nodal stress models by assessing weighted degree centrality, a graph-theoretical measure summarizing overall connection strength, to evaluate whether highly connected network hubs are preferentially vulnerable to volume loss in type 2 diabetes. Across cortical parcels, linear spatial associations between volume statistics and degree centrality did not reach statistical significance for either functional or structural connections. However, across the 14 subcortical structures, gray matter volume differences exhibited a significant negative correlation with normative functional degree centrality, recording a Pearson correlation coefficient of negative 0.56. Because negative t-statistics reflect lower gray matter volume in patients, this subcortical finding demonstrates that structures possessing higher functional connectedness, such as the thalami, displayed greater volumetric decrements, supporting hypotheses that metabolic stress may disproportionately impact central communicative nodes in the brain.
Candidate disease epicenter mapping was subsequently conducted to identify individual brain regions whose healthy connectivity profiles mirror the overall spatial landscape of cortical volume reductions. Each cortical and subcortical seed region’s normative projection pattern across 400 cortical targets was correlated with the unthresholded cortical group-difference map. Under exploratory nominal permutation criteria, the ten highest-ranked functional and structural candidate epicenters were predominantly localized within the somatomotor network, with functional candidates including eight right-hemisphere and two left-hemisphere somatomotor parcels, while all ten structural candidates resided in the right hemisphere. The structural and functional top-ten rankings shared parcels 4, 13, and 14 of the right somatomotor network. However, none of these group-level candidate epicenters survived stringent seed-wise false discovery rate correction across all 414 possible seed locations, establishing that these regional rankings represent hypothesis-generating observations rather than statistically confirmed epicenters.
Because clinical presentations and brain changes vary widely between individuals, the researchers evaluated patient-specific z-score maps standardized against the healthy control reference distribution. Individualized functional hub analyses showed that 63.27 percent of patients exhibited negative correlations with cortical functional centrality and 61.22 percent showed negative correlations with subcortical functional centrality, both displaying statistically significant negative distributional shifts following multiple-comparison correction across four hub tests. Conversely, patient-specific candidate epicenter mapping revealed notable spatial divergence across individuals. Across the 49 participants with diabetes, peak individual cross-subject hit rates reached only 20.41 percent for functional connectivity and 18.37 percent for structural connectivity. Furthermore, while group-level functional candidate rankings were predominantly right-hemispheric, eight of the top ten individual functional candidates by hit rate were left-hemispheric somatomotor parcels, underscoring substantial interindividual variability rather than a uniform disease epicenter across patients.
To evaluate methodological robustness, the authors conducted comprehensive sensitivity analyses using an alternative parcellation scheme based on a 308-parcel subdivision of the Desikan-Killiany atlas. The 308-parcel analysis successfully reproduced the bilateral thalamic volume reductions, the positive cortical structural neighborhood association, the positive subcortical functional neighborhood association, and the negative subcortical functional hub association. However, the exact cortical locations showing significant volume reduction diverged, identifying regions within the left superior temporal sulcus, bilateral insula, and right superior parietal cortex rather than the specific parcels identified in the primary atlas. Candidate epicenter rankings similarly shifted to encompass supramarginal and precentral areas, confirming that while broader network and subcortical findings remained convergent across atlases, precise parcel-level cortical localization was highly sensitive to atlas boundaries.
The researchers also performed critical sensitivity analyses incorporating hypertension status, which was documented in 28 of the 49 participants with diabetes but absent among healthy controls. Upon adding hypertension as an independent covariate alongside age, sex, and total intracranial volume, no regional gray matter volume reductions survived false discovery rate correction in the primary 400-parcel parcellation. Furthermore, subcortical functional neighborhood associations and functional hub associations attenuated below nominal statistical significance. Only the cortical structural connectivity-weighted neighborhood association retained nominal significance across both parcellations, recording a correlation of 0.55 in the 400-parcel atlas and 0.48 in the 308-parcel atlas.
The study authors emphasize important methodological and clinical constraints when interpreting these neuroimaging findings. The cross-sectional design captures structural associations at a single chronological evaluation and cannot determine whether gray matter differences reflect progressive atrophy, neurodevelopmental variations, or the temporal sequence of pathological spread. Additionally, the normative connectome reference was derived from healthy adults aged 22 to 35, introducing an age mismatch with the clinical sample, whose average age approached 60 years. Although the somatomotor network featured prominently across exploratory candidate rankings, clinical records lacked detailed assessments of diabetic peripheral neuropathy, sensory thresholds, proprioception, gait, and motor coordination, preventing direct correlation between imaging patterns and physical impairment. Given the marked sensitivity of the volumetric and functional network metrics to hypertension adjustment, the authors caution that structural brain differences in type 2 diabetes must be interpreted within the broader context of coexisting vascular risk factors.
Subject of Research: Neuroimaging analysis of gray matter volume alterations and normative connectome architecture in type 2 diabetes mellitus
Article Title: Network associations and candidate epicenter mapping of gray matter volume differences in type 2 diabetes mellitus
Article References: Ou, W., Li, M., Zeng, T., Huang, Z., Xiong, H., Xu, S., Wang, X., & Cui, X. (2026). Network associations and candidate epicenter mapping of gray matter volume differences in type 2 diabetes mellitus. Frontiers in Medicine, 13, Article 1998434. https://doi.org/10.3389/fmed.2026.1998434
Image Credits: AI Generated
DOI: 10.3389/fmed.2026.1998434
Keywords: type 2 diabetes mellitus, gray matter volume, neuroimaging, structural MRI, normative connectome, functional connectivity, structural connectivity, brain networks, thalamus, somatomotor network, candidate epicenters, hypertension, Schaefer atlas, spin permutation tests, degree centrality, cross-sectional study, cognitive function
News Source: Cassandra Pierce. (November 19, 2026). Brain Network Organization Shows Gray Matter Volume Differences in Type 2 Diabetes. Scienmag.