Mechanical engineers investigating localized stress amplification have demonstrated an automated computational framework that integrates numerical computing with finite element modeling to evaluate stress concentration factors in stepped circular bars under axial loading. Across structural joints, transmission shafts, couplings, and crankshafts, sudden changes in geometry disrupt uniform stress trajectories and create localized stress spikes where mechanical fatigue and structural failure typically initiate. Classical evaluations have historically depended on empirical graphical design charts, notably those compiled in Peterson stress concentration handbooks, or on analytical elasticity theory developed by researchers such as Neuber. However, conventional manual finite element analysis requires repetitive, labor-intensive interventions to create geometric models, discretize bodies, apply boundary conditions, and extract peak stress fields. To eliminate these manual bottlenecks, researchers developed an interconnected pipeline linking MATLAB with ABAQUS through automated Python scripting, executing parametric simulations across systematic design spaces with minimal user intervention.
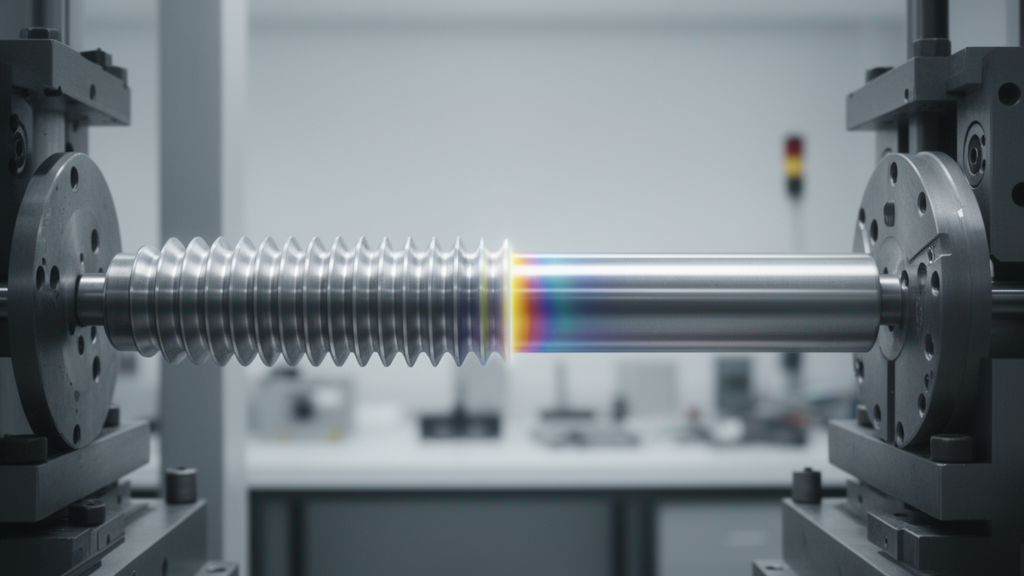
The investigated structural geometry represents a classical stepped shaft configuration consisting of two cylindrical sections of differing diameters connected by an intermediate circular shoulder fillet. The smaller section carries nominal axial tensile stress, while the transitional fillet boundary undergoes steep stress gradients that dictate component fatigue life and structural integrity. Four independent geometric control parameters defined the parametric domain: the individual cylindrical section length, the smaller cross-sectional diameter, the fillet transition radius, and the larger cross-sectional diameter. In the physical problem setup, the structural component was modeled as a linearly elastic, isotropic, and homogeneous material representing standard structural steel, configured with a Young modulus of 210 gigapascals and a Poisson ratio of 0.3. Pure tensile loading was enforced along the longitudinal axis by prescribing a fixed boundary condition at one end of the cylinder while applying a uniform tensile force of 5000 newtons at the opposite extremity.
To execute the automated parametric simulations without manual geometric drafting, MATLAB generated design matrices and programmatically compiled specialized Python scripts tailored for ABAQUS Standard. Upon execution, the Python routines constructed three-dimensional solid geometries, assigned mechanical properties, enforced kinematic boundary constraints, and generated refined computational meshes. Quadratic tetrahedral continuum elements, designated as C3D10 second-order elements, were chosen over linear formulations to guarantee enhanced mathematical accuracy in regions characterized by severe localized stress gradients. The meshing strategy balanced computational economy and precision by establishing global mesh seeding along the shaft length while enforcing high element density and local mesh refinement directly within the shoulder fillet. Once each simulation completed, automated post-processing routines queried the ABAQUS output database, retrieved peak localized von Mises stress values from the fillet zone, and transferred numerical outputs back to MATLAB for comprehensive statistical evaluation.
Prior to conducting production simulation runs, a rigorous mesh convergence investigation was performed on a representative mid-range geometric baseline to confirm that numerical stress calculations remained independent of spatial discretization density. Finite element models with four distinct global element dimensions—specifically 2 millimeters, 1.5 millimeters, 1 millimeter, and 0.5 millimeter—were evaluated to monitor the stability of maximum von Mises stress outputs. The convergence assessment established that calculated peak stresses stabilized once element dimensions within the shoulder fillet dropped beneath a critical refinement threshold, with the variation between the two finest mesh iterations measuring under 2 percent. Consequently, the researchers selected a converged solid mesh configuration comprising 15,763 nodes and 10,363 quadratic tetrahedral elements for all subsequent design-of-experiments investigations. This systematic mesh verification confirmed that subsequent parametric variations reflected authentic geometric influences rather than numerical discretization artifacts.
Design space exploration was structured using a two-level full factorial design of experiments consisting of four control factors evaluated at two levels each, producing a total of sixteen unique simulation cases. The investigated geometric boundaries comprised section lengths of 30 and 60 millimeters, smaller diameters of 20 and 40 millimeters, fillet radii of 3 and 6 millimeters, and larger diameters of 60 and 80 millimeters. For every configuration, the elastic stress concentration factor was calculated as the ratio between the maximum von Mises stress extracted from the shoulder fillet and the nominal axial stress in the smaller diameter segment. The nominal stress was computed analytically by dividing the 5000-newton applied load by the cross-sectional area of the smaller cylinder. This balanced factorial architecture allowed the computational pipeline to isolate primary geometric effects alongside multi-parameter interaction phenomena while keeping simulation counts modest.
Detailed evaluations of representative simulation configurations highlighted substantial variations in localized stress distributions across the examined design domain. In Case 1, which featured a section length of 30 millimeters, smaller diameter of 20 millimeters, fillet radius of 3 millimeters, and larger diameter of 60 millimeters, the maximum fillet von Mises stress reached 25.81 megapascals. When the fillet radius was enlarged from 3 to 6 millimeters in Case 4 with a larger diameter of 80 millimeters, the maximum observed stress decreased to 22.02 megapascals, demonstrating that smoother geometric transitions alleviate local stress concentration. In Case 8, expanding the smaller diameter to 40 millimeters with a 6-millimeter fillet radius and 80-millimeter larger diameter reduced the peak von Mises stress to 6.97 megapascals because the expanded cross section substantially lowered the baseline nominal stress. Among all sixteen evaluated runs, Case 11—configured with a section length of 60 millimeters, smaller diameter of 20 millimeters, fillet radius of 6 millimeters, and larger diameter of 60 millimeters—achieved the lowest stress concentration factor of 1.345, yielding a maximum von Mises stress of 21.41 megapascals.
Statistical evaluation via analysis of variance demonstrated that the smaller diameter and the shoulder fillet radius acted as the principal parameters controlling stress concentration behavior in stepped bars. Analysis of variance indicated that the smaller diameter exhibited the highest statistical significance, followed closely by the fillet radius, with these two parameters jointly accounting for more than 80 percent of the total variation in stress concentration factors. The larger diameter exerted a moderate secondary influence by altering the relative structural stiffness mismatch between adjacent sections, whereas the section length produced a negligible effect on peak localized stresses because it primarily governed longitudinal stress redistribution. Slopes extracted from main effects plots formally established the parameter influence hierarchy as smaller diameter, followed by fillet radius, larger diameter, and section length. Interaction plots revealed predominantly parallel trajectories indicating weak coupling overall, though a moderate interaction emerged between fillet radius and larger diameter, showing that fillet enlargement mitigates stress peaks most effectively at moderate diameter ratios.
To facilitate rapid estimation without repeated numerical meshing, the research team derived a multivariate linear regression equation correlating geometric dimensions directly to the resulting stress concentration factor. The predictive mathematical formulation expresses the stress concentration factor as 1.856 plus 0.00017 multiplied by section length, plus 0.0197 multiplied by smaller diameter, minus 0.090 multiplied by fillet radius, plus 0.0037 multiplied by larger diameter, where all geometric parameters are input in millimeters. Statistical assessment of this regression equation produced a coefficient of determination of approximately 0.91 and an adjusted coefficient of determination of 0.88, demonstrating that the linear formulation accounts for 91 percent of the variance across the design space. Response surface contours generated from the regression model confirmed that the lowest stress concentrations occur near smaller diameters of 20 millimeters paired with fillet radii of 6 millimeters, whereas peak stress amplification concentrates near smaller diameters of 40 millimeters paired with sharp 3-millimeter fillet transitions.
Building on the factorial simulation dataset, the investigators developed and evaluated a supervised machine learning surrogate model designed for instantaneous parametric prediction during early engineering design phases. Prior to model training, input vectors comprising the four geometric variables were normalized to ensure numerical stability and algorithmic convergence across k-fold cross-validation routines. The resulting surrogate model exhibited strong agreement with the finite element training dataset, achieving an average prediction error of approximately 1.2 percent and replicating the regression model coefficient of determination of roughly 0.91. While the linear surrogate model provides a reliable first-order approximation within the tested parameter boundaries, the investigators noted that introducing intermediate geometric levels could reveal nonlinear behaviors that may warrant higher-order response surface methodologies or expanded machine learning architectures in future design extensions.
To confirm the validity of the automated numerical pipeline, finite element predictions were benchmarked against classical empirical values obtained from Peterson stress concentration charts for stepped circular shafts. Representative geometric cases were matched against chart curves using the dimensionless ratios of larger-to-smaller diameter and fillet radius-to-smaller diameter. Across all examined benchmark configurations, numerical finite element calculations agreed with Peterson chart predictions within a deviation margin of 5 to 8 percent. The authors attributed these minor numerical discrepancies to graphical interpolation uncertainties in historical charts, variations in stress averaging techniques, and the superior fidelity of modern three-dimensional solid element discretization over historical simplified analytical approximations. Ultimately, the close correlation validates the MATLAB and ABAQUS integration as an accurate, reproducible computational methodology for parametric mechanical evaluation.
Subject of Research: Automated parametric finite element analysis and surrogate modeling of stress concentration factors in stepped circular bars under axial tension
Article Title: Automated parametric analysis of stress concentration factors using MATLAB and ABAQUS
Article References: Bhosale, S. S., Bhosle, S. M., Mahadik, S. C., & Pondkule, S. M. (2026). Automated parametric analysis of stress concentration factors using MATLAB and ABAQUS. Discover Mechanical Engineering, 5(1), Article 163. https://doi.org/10.1007/s44245-026-00331-7
Image Credits: AI Generated
DOI: 10.1007/s44245-026-00331-7
Keywords: stress concentration factor, stepped circular bar, shoulder fillet, MATLAB, ABAQUS, finite element analysis, design of experiments, factorial design, surrogate modeling, Peterson charts, linear elasticity, structural steel, von Mises stress, mesh convergence, parametric analysis, ANOVA, regression model
News Source: Denise Maddox. (November 14, 2026). Automated Finite Element Analysis Accurately Predicts Stepped Bar Stress Concentration. Scienmag.