A computational methodology termed Machinometrics links the internal decisions of deep neural networks to physical measurements, offering a framework to explain machine learning predictions in healthcare. In a validation study published in BMC Methods, researchers applied the framework to a three-dimensional tooth identification task using computed tomography scans, demonstrating how abstract activations can be grounded in physical properties like density and distance. Convolutional neural networks show utility across biomedical imaging, but clinical adoption remains hindered by opaque architectures that process numerical tensors rather than clinically meaningful anatomy. To assess whether linking post-hoc heatmaps to physical attributes clarifies model behavior, the team trained a three-dimensional ResNet model to classify human teeth. The classification model achieved an average accuracy of 77.72 percent across five-fold stratified cross-validation, establishing an experimental platform to evaluate how explainability methods ground algorithmic decisions in real-world structural data.
The clinical motivation behind Machinometrics addresses the operational limitations of conventional explainable artificial intelligence techniques in healthcare. Standard post-hoc explanation methods, including saliency maps, Gradient-weighted Class Activation Mapping, and Local Interpretable Model-Agnostic Explanations, generate numerical or visual attributions highlighting influential regions within an input image. However, these tools are primarily mathematical mechanisms designed for computer scientists rather than clinicians who require biologically contextualized explanations. Furthermore, attribution heatmaps remain subject to human interpretation, risk oversimplifying complex internal mechanics, and can display vulnerability to adversarial attacks. Existing post-hoc tools approximate model mechanisms within the digital tensor space without connecting numerical activations to tangible biological structures. Because healthcare providers maintain legal and moral responsibility for clinical decisions, bridging the gap between abstract model matrices and physical reality remains essential for building clinical trust.
To resolve this interpretive divide, the research team structured the Physically Grounded Explanation framework around Machinometrics, defined as the systematic integration of model explanations with domain-relevant physical attributes. Under this architecture, the pipeline initiates by employing an off-the-shelf post-hoc attribution algorithm to generate an initial activation heatmap indicating which intermediate features influenced a prediction. Next, computational routines extract objective physical attributes directly from raw volumetric input data, guided by human domain knowledge and clinical relevance. Rather than leaving attribution scores as unanchored heatmaps, Machinometrics links activation values to physical measurements across defined numerical bins, producing qualitative three-dimensional visualizations and quantitative correlation plots. By situating statistical activations within identifiable physical properties, the methodology provides a shared communication medium connecting computer scientists and clinical practitioners. The framework is adaptable, allowing researchers to incorporate alternative classification models, attribution algorithms, or physical metrics according to task requirements.
The empirical dataset supporting the tooth classification experiment comprised extracted human teeth obtained from Tooth Morphology and Endodontics at the Sydney Dental School, alongside a dental student private collection. While the initial collection contained over 1,310 extracted human teeth, partial images lacking identifiable morphological features were excluded, leaving 1,236 valid scanned teeth filed in the final study dataset. Scanning was conducted using a Canon Aquilion Lightning computed tomography scanner, which operates as a 16-row, 32-slice helical system. Exposure and image acquisition settings were set at 80 kilovolts, 30 milliamperes, a 246-millimeter field of view, small focus, 0.5-millimeter slice thickness, an FC30 reconstruction filter, and a pediatric 0.5 protocol. The volumetric scans possessed a cross-sectional dimension of 512 by 512 pixels with a variable axial length dependent on physical scan span. Each tooth specimen received a unique accession number to track its digital processing trajectory.
Dental academics categorized the 1,236 valid scanned teeth into eight anatomical classes to provide ground-truth labels for model training and evaluation. The classified dataset consisted of 250 upper incisors, 87 lower incisors, 184 upper canines, 63 lower canines, 296 upper premolars, 94 lower premolars, 155 upper molars, and 107 lower molars. The computed tomography data were initially collected in Digital Imaging and Communications in Medicine format and converted using 3D Slicer into Nearly Raw Raster Data format, allowing direct loading into Python as numpy arrays via the pynrrd library. Because multiple teeth were arranged together in batches on low-density surfaces during scanning, individual tooth volumes required isolation. Researchers segmented each tooth volume from the background using the connected-components-3d library, enforcing a minimum voxel intensity threshold of 500 and volumetric boundaries between 1,000 and 100,000 voxels, saving each isolated tooth as an independent volumetric file.
To evaluate model performance, the tooth dataset was randomly partitioned into five folds for stratified cross-validation, preserving the proportional representation of each class across all subsets. The team selected an eighteen-layer three-dimensional convolutional neural network architecture, termed r3d_18, which integrates residual connections across layers. Each basic block within the network incorporates a three-dimensional convolution layer, batch normalization, and a rectified linear unit activation function. To leverage learned volumetric representations, the network was pre-trained on the Kinetics400 video classification dataset and fine-tuned on the dental volumes. Volumetric inputs were standardized to dimensions of 64 by 64 by 64 voxels. Model parameters were optimized by minimizing negative log-likelihood loss applied to the SoftMax probability distribution across the eight ground-truth classes. Under this five-fold stratified cross-validation setup, the fine-tuned three-dimensional ResNet model achieved an overall average classification accuracy of 77.72 percent.
Model training was executed within PyTorch using the Adam optimizer on an NVIDIA A100 graphics processing unit with 40 gigabytes of tensor core memory. Systematic experimental tuning assessed learning rates of 0.00001, 0.0001, 0.001, and 0.01, with validation F1-scores peaking at 0.0001. A batch size of 32 was chosen to balance training efficiency against physical memory constraints, providing stable convergence without triggering memory overruns. The researchers monitored training and validation loss curves from epoch 1 through epoch 14, observing that validation loss plateaued around epoch 9 while training loss continued to decline, indicating overfitting and determining 9 epochs as the stopping point. For post-hoc explanation, the investigators implemented Gradient-weighted Class Activation Mapping via the Captum PyTorch library, evaluating gradients at the final convolutional layer. The training dataset served as input for explainability analysis to uncover which anatomical features the network prioritized during feature learning.
Gradient-weighted Class Activation Mapping computed attribution weights by pooling gradients across height, width, and depth dimensions for specific classes, generating attention heatmaps with dimensions of 8 by 4 by 4 voxels that were interpolated to the original 64 by 64 by 64 resolution. To transform these raw heatmaps into physically grounded explanations, the authors extracted two physical attributes from the raw data: normalized density and Euclidean distance. Normalized density utilized calibrated voxel intensity values reflecting tissue attenuation, while distance was defined as the Euclidean distance of each foreground voxel within the tooth to the nearest background voxel, capturing spatial depth and structural thickness. Both attributes were normalized using min-max scaling to project values onto a zero-to-one interval. To establish quantitative Machinometrics plots, normalized density was divided into 64 discrete bins, and normalized distance was divided into 10 bins.
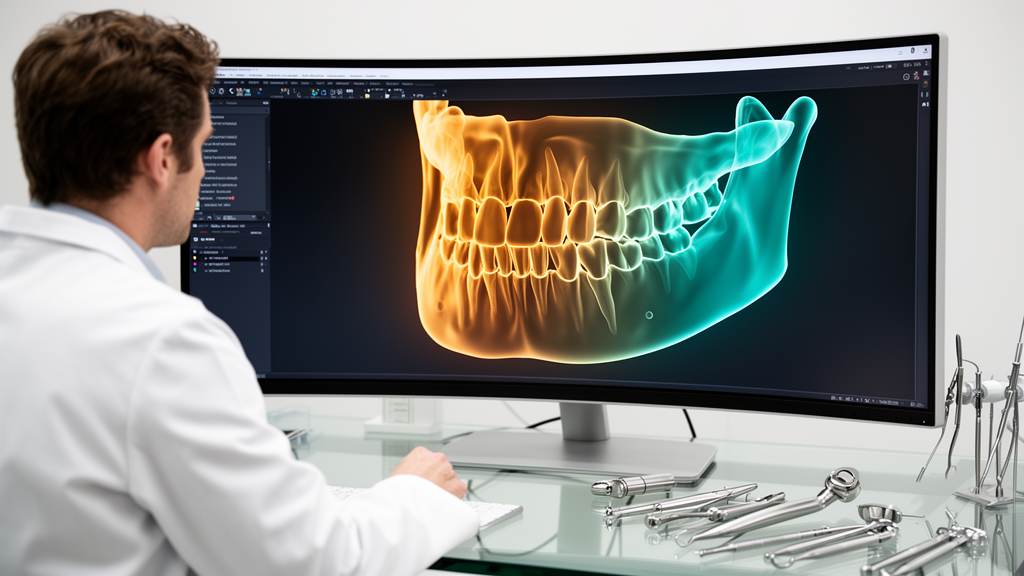
For each specimen, the algorithm computed a correlation vector summarizing average Gradient-weighted Class Activation Mapping values across all voxels falling within each attribute bin, using indicator functions and normalization factors. Averaging these vectors across all samples within a class yielded a final correlation vector representing the relationship between model attention and physical measurements. The resulting Machinometrics density profiles aligned with known tooth anatomy, identifying distinct peaks across structural layers. The highest density regions in computed tomography density maps corresponded to enamel, the mineralized outer surface of the tooth crown, while intermediate densities captured dentine, and the lowest density regions mapped to internal dental pulp tissue. Similarly, distance maps depicted the spatial progression from the external surface toward internal core structures, establishing structural thickness. Integrating heatmap attributions with these physical profiles produced clear cross-sectional visualizations for individual specimens, including lower molar Tooth 8 and upper molar Tooth 13.
To evaluate model decisions interactively and statistically confirm the reliability of attribution patterns, researchers applied Principal Component Analysis to standardized heatmap values across selected physical attribute ranges. Dental academics evaluated three-dimensional reconstructions from selected density intervals to verify whether highlighted regions reflected recognizable anatomy. In lower molar Tooth 8, a density range between 30 and 35 generated interpretable three-dimensional reconstructions resembling lower molar anatomy, with Principal Component Analysis demonstrating tight clustering that explained differences between lower molars and other classes. For upper molar Tooth 13, a density interval between 31 and 36 produced characteristic upper molar reconstructions and formed a distinct statistical cluster. In distance analyses, the shortest distance range between 0 and 2, representing the outermost tooth surface, exhibited strong clustering in Principal Component Analysis, verifying that external surface boundary geometry served as an essential differentiating feature utilized by the neural network across tooth classes.
In contextualizing their framework within explainable artificial intelligence, the investigators compared Machinometrics to NetDissection, an interpretability technique that quantifies neural network representations through overlap with human-annotated concept masks. While NetDissection evaluates unit-level alignment with predefined visual concepts like textures or objects, Machinometrics operates without restricting explanations to individual units and integrates arbitrary physical attributes computationally extracted from volumetric data. The authors noted that visual concepts represent specific instances within the broader scope of physical space, positioning Machinometrics as a generalized interpretability framework. Although the study focused on extracted teeth evaluated within a single computed tomography protocol and an eighteen-layer ResNet model, the underlying principles of volumetric image geometry translate across medical radiography. By establishing a shared physical language between machine learning models and healthcare professionals, Machinometrics demonstrates a practical pathway to recontextualize black-box artificial intelligence systems for transparent clinical decision-making.
Subject of Research: Explainable machine learning framework integrating post-hoc heatmaps with physical attributes in dental computed tomography
Article Title: Machinometrics, a new framework towards explainable machine learning in healthcare
Article References: Lin, J., Hegde, S., Liu, D., Cheng, K. W., Spallek, H., Xu, C., & Gao, J. (2025). Machinometrics, a new framework towards explainable machine learning in healthcare. BMC Methods, 2(1), Article 29. https://doi.org/10.1186/s44330-025-00031-w
Image Credits: AI Generated
DOI: 10.1186/s44330-025-00031-w
Keywords: Machinometrics, Explainable Artificial Intelligence, Deep Learning, Computed Tomography, Tooth Identification, ResNet, Grad-CAM, Principal Component Analysis, Dental Imaging, Healthcare AI, Attribution Maps, Volumetric Imaging, Physical Grounding, 3D Slicer, Tissue Density, Cross-Validation, Captum
News Source: Blake Davidson. (November 14, 2026). Machinometrics Framework Links Dental AI Heatmaps to Physical Attributes for Explainability. Scienmag.