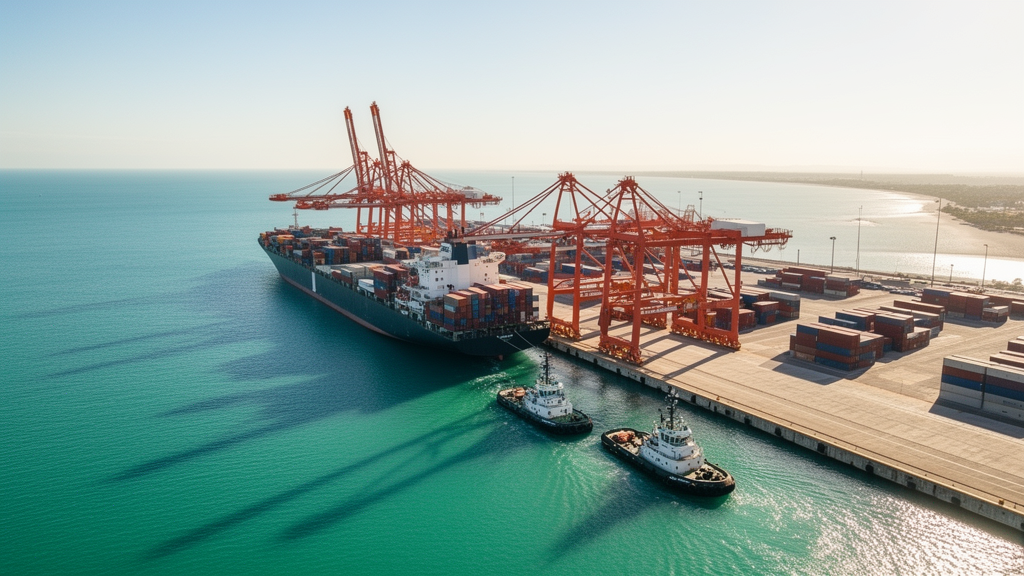
A comprehensive investigation into global maritime logistics has established that superior port infrastructure quality and advantageous geographic location significantly curtail port time variability, whereas elevated vessel flow dynamics directly amplify schedule unpredictability across international container networks. For decades, conventional industry benchmarking frameworks have evaluated maritime terminal performance almost exclusively through average vessel turnaround times. The research team demonstrates that this traditional reliance on central tendency systematically masks temporal variance, obscuring the statistical dispersion of port call durations that poses the greatest operational risk to liner shipping schedules and global supply chain reliability.
To establish a rigorous conceptual foundation, the authors delineate clear boundaries between three interrelated phenomena that previous transport literature frequently conflated: port congestion, port delay, and port time variability. Within this framework, port congestion represents a physical state where arriving vessel demand exceeds terminal processing capacity at a specific moment in time. Port delay constitutes an operational outcome, quantified as the excess duration a ship remains at port beyond its scheduled or anticipated departure window. Conversely, port time variability serves as an analytical reliability metric that captures the statistical dispersion of port call durations. By defining port time variability as the coefficient of variation, calculated by dividing the standard deviation of port times by the mean duration, the metric standardises operational dispersion, permitting meaningful comparisons across disparate maritime hubs regardless of whether their absolute turnaround averages are inherently long or short.
The empirical architecture of the study integrates three diverse global datasets to construct and evaluate its operational variables. Continuous vessel trajectory information was captured via high-frequency Automatic Identification System maritime tracking data, recording the exact arrival and departure timestamps across the global port sample. Physical terminal attributes were compiled from the National Geospatial-Intelligence Agency World Port Index, incorporating five distinct locational variables: natural shelter afforded, harbour dimensions, channel depth, anchorage depth, and cargo pier depth. National logistics competence and terminal infrastructure standards were sourced from the World Bank Logistics Performance Index and its Executive Opinion Survey. These institutional datasets contributed evaluated dimensions covering customs processing efficiency, transport infrastructure quality, international shipment ease, logistics service tracking capabilities, and overall processing timeliness, establishing robust macro-level operational indicators.
A paramount analytical advantage of utilising continuous vessel tracking records over conventional port-reported statistics involves the systematic inclusion of waiting periods outside formal administrative boundaries. Standard administrative turnaround metrics, such as those compiled by the United Nations Conference on Trade and Development, record vessel duration only after a ship officially crosses into inner port waters. This administrative threshold completely ignores hours or days spent waiting at open-sea anchorages, which represents the primary source of operational delay during severe bottleneck episodes. By tracking continuous vessel movements prior to port entry, the research methodology captures complete transit trajectories from initial approach through pilotage, anchorage waiting, and berth mooring. This comprehensive spatial tracking eliminates reporting discrepancies and jurisdictional reporting biases that have historically undermined cross-border port performance comparisons.
The study contextualises systemic terminal delays within an adapted logistics vicious and virtuous cycle framework derived from classical economic development models. Originally articulated by Ragnar Nurkse to explain persistent macroeconomic poverty traps, the theory illustrates how reinforcing negative feedback loops perpetuate low-productivity equilibrium states. When applied to maritime container terminals, a port suffering from poor geographic location or deficient physical infrastructure experiences chronic service bottlenecks, driving up vessel dwell times and inducing operational unpredictability. Heightened schedule variability subsequently discourages container liner services, depressing vessel call volumes and diminishing terminal revenues. This revenue contraction starves the port authority of investment capital necessary to modernize handling equipment, dredging channels, or software systems, effectively locking the maritime gateway into a self-sustaining cycle of rent-seeking, operational stagnation, and degraded logistics service.
To evaluate these multidimensional operational relationships empirically, the researchers formulated a structural equation model using maximum likelihood estimation after verifying multivariate normality across observed variables. The measurement model demonstrated exceptional psychometric robustness, with all standardized factor loadings exceeding 0.70, squared multiple correlations surpassing 0.50, and average variance extracted values outperforming the 0.50 convergent validity threshold. Construct composite reliability and Cronbach alpha coefficients uniformly exceeded 0.70 across all latent dimensions. The global structural model demonstrated strong goodness of fit, yielding a chi-square to degrees of freedom ratio of 2.34, comfortably below the conservative benchmark threshold of 3.0. Confirmatory fit statistics further substantiated structural validity, exhibiting a Comparative Fit Index of 0.98, an Incremental Fit Index of 0.95, a Tucker-Lewis Index of 0.97, and a Standardized Root Mean Square Residual of 0.03.
The full structural equation model revealed significant direct effects across several primary operational pathways. Port dynamic flow, quantified through incoming and outgoing vessel traffic volumes and maritime growth rates, emerged as the single strongest positive predictor of port time variability, exhibiting a path coefficient of beta equals 0.41 (t-statistic of 13.45, p less than 0.01). This confirms that high traffic density exacerbates scheduling dispersion. Conversely, favourable location conditions exerted the strongest direct mitigating effect on port time variability, with a path coefficient of beta equals -0.27 (t-statistic of 21.07, p less than 0.01). High-quality port infrastructure and superior service responsiveness also exerted significant direct negative influences on schedule variability, recording path coefficients of beta equals -0.21 (t-statistic of 17.49, p less than 0.01) and beta equals -0.18 (t-statistic of 10.78, p less than 0.01), respectively.
The empirical findings concurrently illuminated the structural determinants of maritime vessel flow and inter-port network connectivity. Advantageous natural location conditions exerted a strong positive direct impact on port network connectivity, registering a path coefficient of beta equals 0.42 (t-statistic of 13.17, p less than 0.01). Furthermore, location conditions, terminal infrastructure quality, and network connectivity each significantly stimulated port dynamic vessel flow, recording positive path coefficients of beta equals 0.34 (t-statistic of 22.61, p less than 0.01), beta equals 0.21 (t-statistic of 19.21, p less than 0.01), and beta equals 0.13 (t-statistic of 9.56, p less than 0.01). However, the hypothesized direct path from service responsiveness to dynamic vessel flow yielded an insignificant result (beta equals 0.18, t-statistic of 1.94, p greater than 0.01), and direct port connectivity displayed no statistically significant link to port time variability (beta equals 0.11, t-statistic of 2.72, p greater than 0.01).
Mediation pathways within the structural network were formally verified utilizing bias-corrected bootstrap estimation procedures executing 2,000 resamples to generate 95 percent confidence intervals. The statistical analyses demonstrated that service responsiveness partially mediates the relationship between port infrastructure quality and port time variability, exhibiting an indirect effect size of beta equals 0.321 (p less than 0.01). Simultaneously, dynamic vessel flow acts as a potent partial mediator linking infrastructure quality to port time variability (beta equals 0.384, p less than 0.01), as well as mediating the path connecting physical location conditions to variability (beta equals 0.412, p less than 0.01). A complex serial mediation path was also substantiated, wherein natural location conditions influence overall port time variability sequentially through inter-port network connectivity and dynamic flow (beta equals 0.195, p less than 0.01).
The study highlights how real-world maritime disruptions and operational terminal profiles intersect with these identified structural pathways. Macroeconomic vessel tracking data documented that the global mean proportion of operating time commercial ships spent at terminals escalated from 31.7 percent in 2019 to 35.7 percent during 2022. Recent geopolitical shocks, including Houthi maritime strikes diverting international container traffic away from the Suez Canal around the Cape of Good Hope, elevated global containership fleet demand by roughly 12 percent in 2024. The authors observe that dedicated transshipment hubs, such as Singapore or Tanger Med, absorb vast vessel volumes that stimulate traffic-induced variability under the dynamic flow pathway, yet counter these pressures via dedicated high-capacity terminal automation. Conversely, domestic gateway ports remain acutely vulnerable to natural channel depth limitations, suffering compounding berthing backlogs whenever vessel scales expand.
These structural findings provide critical operational implications for terminal authorities, container carriers, and maritime trade policymakers aiming to dismantle port inefficiency traps. Strategic capital expenditure must extend beyond simple berth expansion, prioritizing digital integration through Single Window Systems, unified port community networks, and automated customs processing platforms to enhance operational service responsiveness. Furthermore, the authors advocate for institutional governance reforms, demonstrating that transitioning from municipal service or tool port models toward landlord port administration aligns private operational incentives with terminal throughput velocity. While acknowledging study limitations regarding country-level infrastructure aggregations and historical snapshot boundaries, the researchers highlight the transformative potential of marrying high-frequency vessel tracking analytics with machine learning systems to optimize real-time berth scheduling, mitigate maritime bottlenecks, and stabilize international trade networks.
Subject of Research: Structural equation modelling of global port time variability and maritime logistics reliability
Article Title: Modelling the factors affecting port time variability
Article References: Chhetri, P., Trakoonsanti, L., Singh, A., & Shahparvari, S. (2026). Modelling the factors affecting port time variability. European Transport Research Review, 18(1), Article 107. https://doi.org/10.1186/s12544-026-00862-w
Image Credits: AI Generated
DOI: 10.1186/s12544-026-00862-w
Keywords: port time variability, maritime logistics, Automatic Identification System, structural equation modelling, port infrastructure, supply chain reliability, vessel turnaround time, port congestion, port network connectivity, dynamic vessel flow, service responsiveness, anchorage waiting time, World Port Index, Logistics Performance Index, vicious cycle theory, liner shipping operations
News Source: Denise Maddox. (November 13, 2026). Vessel Tracking Analysis Shows Port Infrastructure and Location Curb Schedule Unpredictability. Scienmag.