Researchers at Lawrence Berkeley National Laboratory and collaborating institutions have developed a multi-physics geophysical imaging approach to monitor time-lapse changes in water and steam concentrations within The Geysers geothermal field in California. Published in Geothermal Energy, the study demonstrates that combining continuously monitored microseismic events with repeat magnetotelluric observations allows for the generation of detailed time-lapse images of subsurface geophysical properties. These images correspond to temporal changes in fluid saturation, flow paths, and barriers within the reservoir, providing a comprehensive view of the dynamic processes occurring beneath the world’s largest geothermal power plant.
The Geysers field, located in the Mayacamas Mountains of northern California, generates approximately 1.2 gigawatts of electricity. Understanding the precise distribution of water and steam within this highly heterogeneous reservoir is critical for effective resource management, including optimizing water injection, steam production, and planning for new well placements. Traditional borehole observations provide only point measurements of the three-dimensional reservoir, necessitating geophysical methods that can image reservoir properties from the surface with sufficient spatial resolution.
The study utilized a dataset comprising travel-time data from microseismic events recorded at surface stations over an area of approximately 75 square kilometers. This seismic data was collected continuously from 2018 to 2023 using two installed seismic data acquisition networks: the permanent Berkeley Geysers network and a temporary California Energy Commission dense seismic network. The seismic stations consisted of three-component geophones with a 4.5-Hz resonance frequency, and the data were automatically processed using an artificial intelligence-based analysis package that included PhaseNet for arrival-time picking and the Gaussian Mixture Model Association for event location. This processing effort identified 224,000 earthquakes with magnitudes ranging from 0.0 to 3.0, yielding 8.3 million P-wave and 8.7 million S-wave arrival times.
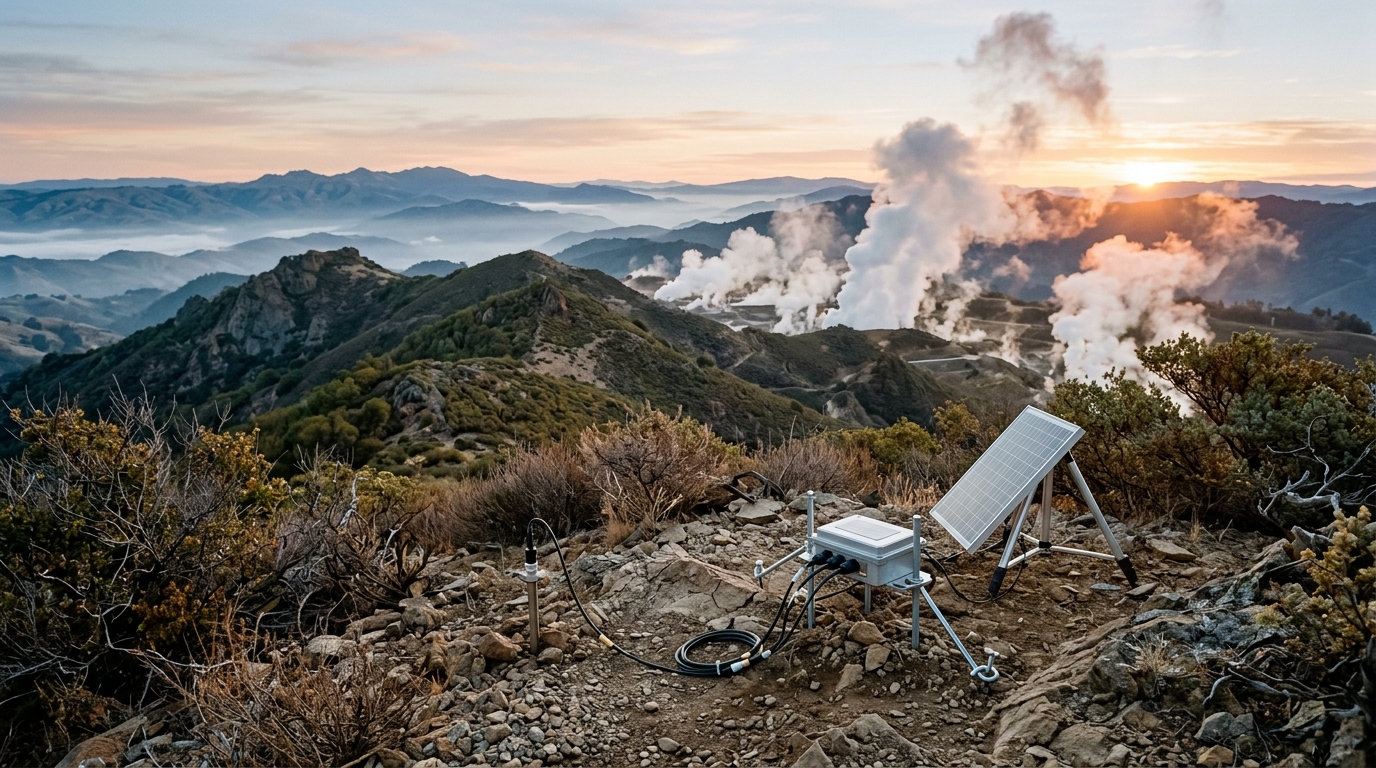
In parallel with the seismic monitoring, the team conducted three repeat magnetotelluric surveys in 2021, 2022, and 2023. Magnetotellurics is a passive electromagnetic method that measures the Earth’s electrical response to natural time-varying magnetic fields, providing data on subsurface electrical resistivity. This property is directly sensitive to the presence, salinity, temperature, and phase of subsurface fluids. Each magnetotelluric station included two horizontal orthogonal magnetic induction coils and two orthogonal electrical dipoles, with data recorded on a repeating schedule to allow for remote reference processing. The resulting data were analyzed using the BIRRP code to estimate transfer functions and inverted in three dimensions using the ModEM code to generate electrical conductivity models.
The core innovation of the study lies in the cooperative joint inversion of the seismic and magnetotelluric data. Rather than inverting the datasets separately, the researchers employed a structural similarity approach to enforce consistency between the seismic velocity models and the electrical conductivity models. In this method, the Vp/Vs ratio derived from seismic inversion serves as a structural reference, while the electrical conductivity model is free to change to minimize data misfit and a cross-gradient term. This approach leverages the higher resolution of the seismic data at reservoir depths to guide the magnetotelluric inversion, which typically suffers from lower lateral resolution due to sparse station spacing.
The seismic P- and S-wave velocities are combined to create three-dimensional images of the Vp/Vs heterogeneity. In fractured rock, gaseous fluids such as steam are characterized by a low Vp/Vs ratio, whereas liquid fluids such as water are characterized by a high Vp/Vs ratio. Conversely, electrical resistivity is high in steam-saturated zones and low in water-saturated zones. By correlating the geophysical images with known water injection and steam production volumes, the researchers calibrated the data and gained confidence in the results. This calibration allows the imaging technique to be applied throughout the reservoir where borehole data are unavailable, providing a continuous map of fluid distribution.
The results of the cooperative joint inversion showed a significant enhancement in the structural similarity between the Vp/Vs and electrical conductivity images compared to standalone inversions. For instance, the shallow low-conductivity steam reservoir was more clearly identified in the joint inversion, with its dipping trend matching that of the seismic image. The deep low-conductivity structures also closely resembled the low Vp/Vs structures found in the corresponding regions of the seismic model. This improved consistency allows for a more precise examination of spatiotemporal changes within the geothermal reservoir, facilitating better estimates of rock properties and the spatial distribution of steam and water at depth.
Temporal changes in the reservoir were analyzed by comparing the 2023 data with baseline data from 2018 to 2019 and with the 2021 data. Positive temporal changes in the Vp/Vs ratio were observed near major water injectors, suggesting increased water saturation around the injection wells. The most significant changes were found near boreholes OS-15 and Prati-15, where water injection commenced in January 2020. The spatial correlation between the high Vp/Vs changes and the inferred flow patterns from tracer tests and induced seismicity suggests that the seismic data accurately predicted an increase in water saturation during the observation period.
In the northwest Geysers area, two parallel faults, the Caldwell Ranch and Caldwell Pines faults, encompass a region showing a negative change in the Vp/Vs ratio. This indicates an increase in steam concentration over the 3.5-year observation period. The distinct delineation of high and low Vp/Vs across these faults supports previous interpretations of reduced fault permeability, suggesting that these faults outline a semi-closed compartment within the reservoir. Similarly, in the southeast part of the field, both the conductivity and Vp/Vs images indicated increased water content around a group of water injectors, although around well GDCF36A28, both images showed an increase in steam content despite water injection in the region.
The study acknowledges that the resolution of the final joint model is spatially variable. The central reservoir represents the zone of highest reliability due to overlapping sensitivities of the seismic and magnetotelluric methods. However, in peripheral zones where one method lacks sensitivity, such as the deep northwest with poor magnetotelluric coverage or the shallow margins with poor seismic ray coverage, the joint model effectively relies on the single-physics sensitivity. In these areas, the resulting images are interpreted with lower confidence. Additionally, the shallow conductive cap layer present in the standalone magnetotelluric model was not inherited by the joint seismic model due to a grid resolution mismatch, as the seismic grid prioritizes higher resolution at deeper target reservoir depths.
The cooperative joint inversion approach mitigates convergence issues by splitting the joint objective function into manageable subsets. The structural information from the higher-resolution Vp/Vs model is infused into the conductivity model by minimizing a cross-gradient objective function. The resulting conductivity model, which shares structural similarity with the seismic model, serves as a new starting model for a subsequent three-dimensional magnetotelluric inversion. This refinement process is halted once the magnetotelluric data misfit ceases to decrease, ensuring that features in the Vp/Vs model that are unsupported by or contradictory to the magnetotelluric data are rejected in favor of fitting the measured electromagnetic responses.
The findings of this study have significant implications for the management of geothermal resources. By providing a detailed, time-lapse view of the reservoir, the technique allows operators to optimize reservoir management and drilling programs. Understanding the spatial distribution of water and steam reduces the risk of drilling dry holes, which can cost between US$7.0 million and US$8.3 million depending on well depth. The technique is applicable to other geothermal reservoirs, particularly in the US Basin and Range region, where natural or induced seismicity is observed. The low cost of data acquisition, due to the use of inexpensive recording stations and automated processing, makes this approach a viable tool for enhancing geothermal energy generation and ensuring the sustained viability of geothermal resources.
Future studies may investigate the combination of passive seismic, magnetotelluric, and controlled source electromagnetic imaging to further enhance resolution and coverage. Controlled source electromagnetic data can be acquired using a limited number of grounded electric dipole sources, keeping data acquisition costs low while ensuring imaging depths that effectively cover geothermal reservoirs. Alternatively, different methods for jointly inverting the datasets, such as petrophysically guided models or multiple grids to accommodate the different resolution of each dataset, could provide more equally weighted models. The current study establishes a robust framework for monitoring reservoir processes, demonstrating the power of multi-physics geophysical imaging in understanding complex subsurface systems.
Subject of Research: Multi-physics geophysical imaging of geothermal reservoir dynamics
Article Title: Monitoring reservoir processes at The Geysers geothermal field: joint time-lapse acquisition and cooperative joint inversion of passive seismic and magnetotelluric data
Article References: Alumbaugh, D., Gritto, R., Peacock, J., Um, E., Ulrich, C., Jarpe, S., & Hartline, C. (2026). Monitoring reservoir processes at The Geysers geothermal field: joint time-lapse acquisition and cooperative joint inversion of passive seismic and magnetotelluric data. Geothermal Energy, 14(1), Article 14. https://doi.org/10.1186/s40517-026-00384-7
Image Credits: AI Generated
DOI: 10.1186/s40517-026-00384-7
Keywords: Geothermal Energy, The Geysers, Passive Seismic, Magnetotellurics, Joint Inversion, Reservoir Monitoring, Fluid Saturation, Geophysical Imaging, Water Injection, Steam Production, Monitoring, reservoir
News Source: Violet Maxwell. (November 8, 2026). Joint Seismic and Electromagnetic Imaging Maps Geysers Reservoir. Scienmag.