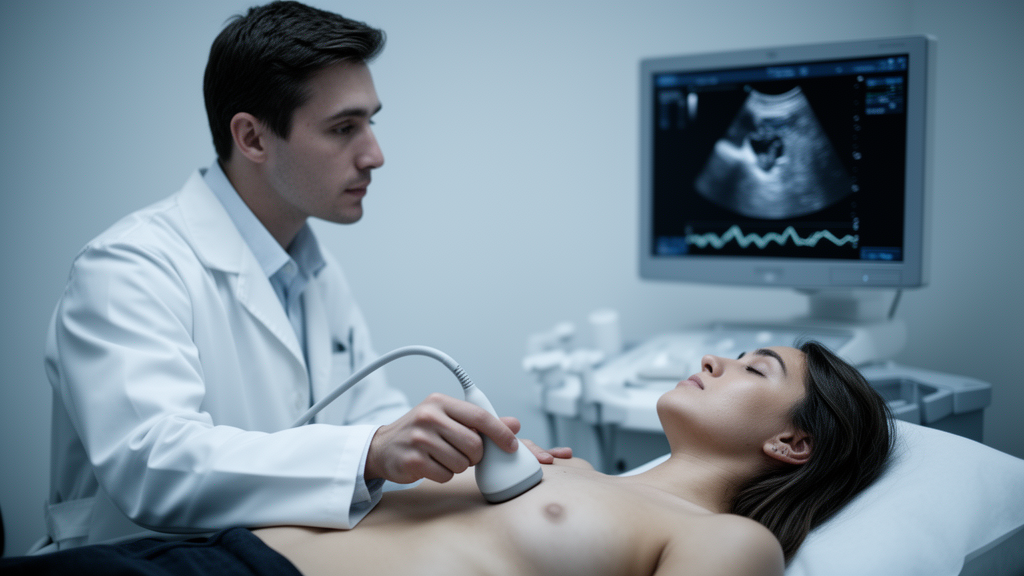
When cardiologists scan serial echocardiogram reports for a shift in right ventricular systolic pressure, they rarely announce every wiggle in the numbers. A new analysis from Stanford University, published in Echo Research & Practice, has now quantified exactly when they decide a change is worth reporting, and the answer is surprisingly consistent: an absolute shift of roughly 8 mmHg, judged against whether the new value sits outside the reference range. The same study found that the measurement itself is noisier than many clinicians assume, with analytic variability of 8 to 10 percent between expert readers, implying that only changes of at least about 15 percent relative to baseline can be trusted as real.
Right ventricular systolic pressure, or RVSP, is the standard echocardiographic estimate of pulmonary artery pressure. It is derived from the peak velocity of the tricuspid regurgitation jet using the simplified Bernoulli equation, with an added estimate of right atrial pressure. Pulmonary hypertension, defined invasively by a mean pulmonary arterial pressure above 20 mmHg on right heart catheterization, is monitored closely with this metric in patients with heart failure and pulmonary vascular disease. Yet despite decades of use, no guideline specifies what constitutes a meaningful change in RVSP between two studies. Clinicians have been left to rely on intuition and experience, and the Stanford team set out to make that intuition visible.
The researchers mined the Stanford CardioShare Registry, linking echocardiography reports with right heart catheterization records. From an initial pool of 19,039 patients referred for catheterization between January 2005 and June 2023, a series of exclusions for missing conclusions, absent RVSP mentions, and unlinked timestamps left 5,934 patients with 32,656 pairs of consecutive echocardiograms carrying reported RVSP values. Because the reports are narrative text rather than structured data, the team used natural language processing built on Python regular expressions to sort each pair into four categories: increase, decrease, no change, and no direct mention. A word bank of clinician descriptors anchored the classification, and qualitative statements were cross-checked against the actual numerical direction of change.
The distribution of reporting behavior was itself informative. Physicians declared RVSP stable in 48.9 percent of pairs, increased in 12.5 percent, and decreased in 9.9 percent, while 28.7 percent of pairs contained no direct reference to any change in RVSP. When the qualitative labels were compared with the measured differences, the no-change category followed a normal distribution centered near zero, with a median absolute change of minus 0.3 mmHg. Pairs labeled as increased had a median absolute change of 13 mmHg and a median relative change of 32 percent, while those labeled decreased showed a median absolute change of 13 mmHg and a relative change of 26 percent. In fewer than 1 percent of cases, hedged terms such as might and possibly appeared, and the authors note that the large silent category could include instances where meaningful changes were overlooked.
To extract the implicit decision rules, the team turned to Classification and Regression Tree analysis, a machine learning method that recursively splits data at the thresholds that best separate outcome classes, measured by the Gini impurity index. Two binary trees were built, one contrasting increase against no change and the other decrease against no change, with a maximum depth of three. Candidate split variables were absolute change, relative change, and either the baseline or follow-up RVSP value, since these measures are mathematically entangled. For both directions, the root node split landed on an absolute change of 8 mmHg, the single most influential threshold in physician decision-making.
The trees revealed a layered logic. If RVSP rose or fell by 8 mmHg or less, the model classified the pair as no change. Changes larger than 13 mmHg were almost always reported as a genuine shift. The interesting zone lay between 8 and 13 mmHg, where the decision depended on where the pressure sat relative to reference limits. For decreases in that intermediate band, the tree consulted the baseline RVSP, using a cutoff of 26 mmHg: a drop of less than 13 mmHg from a baseline at or below 26 mmHg was still called no change. For increases, the follow-up value mattered instead, with a cutoff of 31 mmHg; a rise of less than 13 mmHg was still labeled increased if the new value reached 31 mmHg or higher. Relative change influenced deeper layers of both trees but never dominated the top-level reasoning.
Performance of the trees was tested with stratified five-fold cross-validation. The increase model achieved an accuracy of 0.83 with an F1-score of 0.79, while the decrease model reached an accuracy of 0.81 and an F1-score of 0.74, indicating that the simple threshold rules captured a substantial share of actual reporting behavior. Agreement between the automated text classification and a level-three cardiologist’s manual review of 27 randomly selected cases was excellent, with a Cohen’s kappa of 0.80. No previous study, the authors note, has used decision tree analysis to reverse-engineer physician reporting practices in cardiovascular imaging.
Knowing what clinicians do is only half the question; the other half is whether those thresholds exceed the noise floor of the measurement itself. For that, the team assembled a separate cohort of 210 healthy volunteers from the Stanford Aging Study and 208 patients with confirmed pulmonary arterial hypertension, defined by a mean pulmonary arterial pressure above 20 mmHg and a pulmonary arterial wedge pressure below 15 mmHg. Two blinded core laboratory cardiologists, working from Philips iE33 and EPIQ 7 acquisitions after a standardized training phase, independently measured peak tricuspid regurgitation velocity on every study. The two readers’ RVSP estimates correlated strongly, at 0.94, but they were not identical.
The duplicate analysis, using a robust percentile method that resists outliers and separates bias from precision, yielded a scaled analytic precision of 8.9 percent, with a median absolute bias between readers of 3.17 mmHg and a relative median bias of 10.23 percent. Precision was worst at lower RVSP values, where the same absolute reader difference represents a larger fraction of the measurement. Combining this analytic variation with an assumed within-subject biological variation of 4 percent, drawn from longitudinal CardioMEMS sensor data in heart failure patients, produces a reference change value of at least 20 percent, and the abstract reports a 15 percent figure under slightly different assumptions. Either way, the implied threshold is far above the small shifts that often trigger a report line in clinical practice.
The practical consequence is an algorithm now adopted in the Stanford laboratory: report a change in RVSP only when the absolute shift reaches 8 to 10 mmHg and the relative change is at least 20 percent, always checking that the new value falls outside reference limits and interpreting the result alongside chamber size, ventricular function, and the clinical pre-test probability of change. The authors are careful to frame these as practice-derived and modeling-based thresholds, not outcome-validated ones. Their cohort represents a single high-volume referral center enriched for advanced heart and lung disease, physician interpretation of prior studies was not accounted for, and reliable biological variation data for RVSP remain scarce. Future work, they argue, should validate the thresholds against patient outcomes and explore whether automated segmentation and artificial intelligence tools can tighten the technical variability that currently sets the floor for detecting real change.
Subject of Research: How physicians report changes in right ventricular systolic pressure on echocardiography and how measurement variability shapes meaningful change thresholds
Article Title: Reporting changes in right ventricular systolic pressure: insights from Classification and Regression Tree (CART) analysis
Article References: Bagherzadeh, S. P., Malunjkar, K. S., Mantri, N. M., Celestin, B. E., Zamanian, R. T., Heidenreich, P., Schnittger, I., Salerno, M., Oxborough, D., Augustine, D., Benza, R., Santana, E. J., & Haddad, F. (2026). Reporting changes in right ventricular systolic pressure: insights from Classification and Regression Tree (CART) analysis. Echo Research & Practice, 13(1), Article 19. https://doi.org/10.1186/s44156-026-00120-8
Image Credits: AI Generated
DOI: 10.1186/s44156-026-00120-8
Keywords: echocardiography, right ventricular systolic pressure, pulmonary hypertension, reference change value, CART analysis, measurement variability, tricuspid regurgitation velocity, natural language processing, Stanford CardioShare Registry, clinical reporting thresholds, Reporting, changes
News Source: Ophelia Keating. (October 30, 2026). Echocardiographers Flag Right Ventricular Pressure Changes Only Beyond an 8 mmHg Threshold. Scienmag.