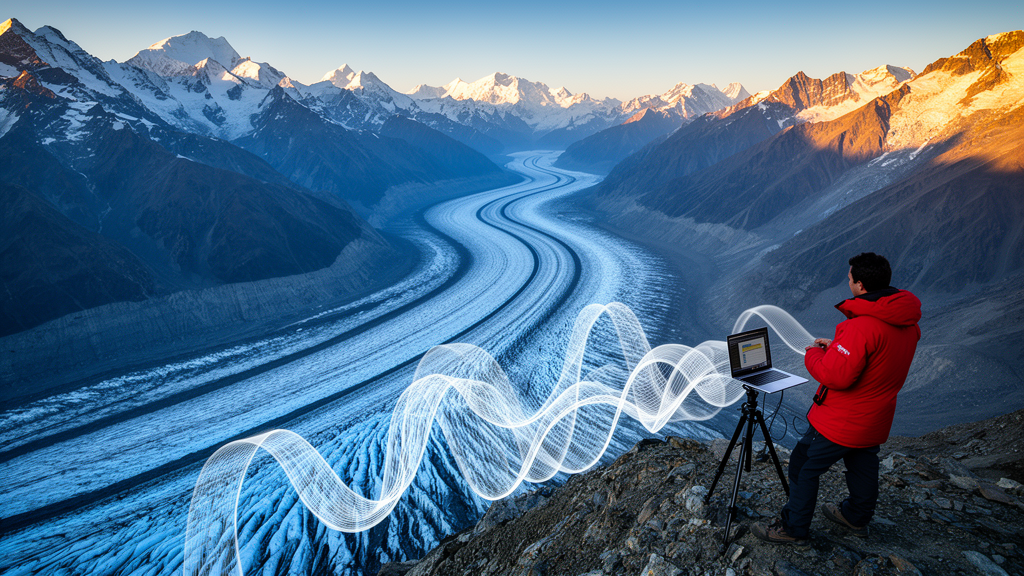
Glacier surface velocity is one of the most direct signals of how a glacier is behaving, yet explaining why ice moves faster in some places than others has long been difficult. A new study in Earth Science Informatics tackles this problem for Chhota Shigri Glacier in the Western Himalaya using an Explainable Geospatial Artificial Intelligence (GeoAI) framework that combines machine learning with interpretable analysis.
The research, published on 30 October 2026, was led by Vansheika Thakur and Chander Prakash. Their goal was not simply to predict glacier surface velocity, but to understand which factors explain its spatial variability along the glacier’s centre flowline.
The team assembled a rich set of predictors. Modelled ice thickness and remote sensing-derived glacier surface velocity were combined with terrain variables derived from the SRTM digital elevation model, land surface temperature from Landsat-8, and spectral indices derived from Sentinel-2 imagery. The temperature and spectral data were processed in Google Earth Engine for the period August to November in 2017 and 2018.
All variables were extracted at 163 valid centre-flowline samples spaced at a nominal 50 metres. This sampling design allowed the researchers to characterise how velocity changes along the main flow path of the glacier, where geometric, topographic, thermal and surface-condition factors interact in complex ways.
Because glacier data are spatially autocorrelated, ordinary random validation can overstate model skill. To counter this, the study used five-block spatial validation when evaluating conventional machine-learning models, tree-based ensembles and artificial neural networks, reducing bias from samples that are geographically close to one another.
The best performance came from histogram-based gradient boosting using the full predictor set without distance, achieving an out-of-fold R² of 0.636, an RMSE of 7.743 metres per year and an MAE of 5.755 metres per year. By contrast, the artificial neural network benchmark, an MLP, showed poorer spatial generalisation, with an out-of-fold R² of 0.454.
The explainability analysis pointed to ice thickness and elevation as the dominant predictors of velocity variability, with land surface temperature providing secondary explanatory information. An elevation-adjusted residual analysis further indicated positive residual velocity sensitivity to temperature anomalies, particularly in the middle-elevation band of the glacier.
The authors are careful about what these results mean. The framework identifies predictive associations, not causal climatic attribution, and the findings apply to a single-glacier case study. Even so, the work demonstrates that explainable GeoAI can deliver physically interpretable insights into glacier dynamics, offering a template for combining Earth observation data, machine learning and interpretability tools in mountain glaciology.
Subject of Research: Explainable machine learning analysis of glacier surface velocity variability on a Western Himalayan glacier
Article Title: Explainable GeoAI for glacier surface velocity variability in the Western Himalaya
Article References: Thakur, V., & Prakash, C. (2026). Explainable GeoAI for glacier surface velocity variability in the Western Himalaya. Earth Science Informatics, 19(12), Article 235. https://doi.org/10.1007/s12145-026-02290-9
Image Credits: AI Generated
DOI: 10.1007/s12145-026-02290-9
Keywords: glacier surface velocity, Chhota Shigri Glacier, Western Himalaya, Explainable GeoAI, machine learning, ice thickness, land surface temperature, remote sensing, Google Earth Engine, spatial validation, gradient boosting, glacier dynamics
News Source: Denise Maddox. (October 30, 2026). Explainable AI maps what drives glacier flow in the Western Himalaya. Scienmag.