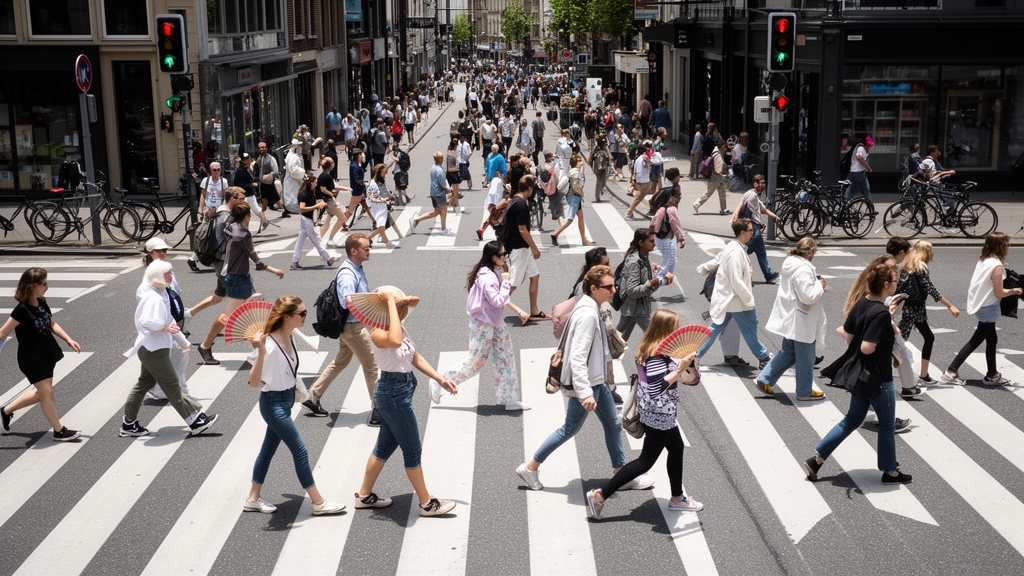
A year of continuous video footage from a busy Japanese shopping street has revealed something that daily averages would have hidden forever: pedestrians respond to heat and to pandemic emergency rules in strikingly different ways depending on when they walk and why. Morning commuters in Fukuoka adjusted their pace mainly to temperature, while nighttime walkers responded primarily to government emergency restrictions rather than thermal conditions. The finding comes from a computer-vision study published in the journal Computational Urban Science, in which researchers tracked walking speeds across a full year, three States of Emergency, and every variation of weather the city could deliver.
The research team, led by Mohamed A. Abdelwahab together with Shizuo Kaji, Maiya Hori, and Shigeru Takano, installed a camera system along Kawabata Shopping Street, a roughly 400-meter pedestrian-only corridor in Fukuoka, Japan’s fifth-largest city. The street sits adjacent to a metro station that funnels heavy commuter traffic through its northern entrance, and it connects three major urban wards: Nakasu-Kawabata, Tenjin, and Hakata. Because the corridor is linear and free of vehicles, the site offered unusually clean conditions for tracking human movement, with a diverse mix of commuters, shoppers, and tourists passing through at different hours of the day.
Technically, the framework combined two well-established deep learning tools. A real-time object-detection model called YOLOv4 identified pedestrians in each video frame, while a multi-object tracking algorithm called DeepSORT linked those detections across frames to reconstruct individual walking trajectories. A primary camera mounted 4.5 meters above the street captured a top-down view of movement along the corridor. To convert image coordinates into real-world distances, the researchers used a homography transformation based on four calibrated control points marked on the street surface. Walking speeds were then computed from the time each pedestrian took to cross a defined measurement zone, and statistical outliers beyond plausible human speed ranges were removed using interquartile range filtering.
The pipeline also included a rule-based validation step designed to eliminate tracking artifacts. The observation region was divided into three sequential zones separated by two virtual reference lines positioned four meters apart: an approach zone, a measurement zone, and a departure zone. Valid pedestrian movement required sequential progression through all three zones. Trajectories that skipped zones, reversed direction, or fragmented into discontinuous segments were classified as detection noise and excluded from analysis. Only physically consistent trajectories survived this filtering, ensuring that the speed estimates reflected genuine walking behavior rather than errors introduced by the tracking software.
Data collection ran continuously from January through December 2021, with one significant gap: a hardware failure caused by heat shut the system down between July 2 and August 21, an interval the researchers excluded from all analyses. During 2021, Fukuoka Prefecture issued three States of Emergency, policy declarations that asked residents to avoid nonessential outings, particularly after 8:00 to 9:00 PM, and that shortened business hours for commercial facilities. Although these measures were legally non-coercive and relied on voluntary compliance, prior research has shown they can substantially alter mobility through social norms and risk perception. The team segmented the year into emergency and non-emergency periods, using the declarations as an integrated policy indicator that captured the combined effect of multiple contemporaneous restrictions.
The analysis divided each day into four time slots: morning from 7 to 9 AM, afternoon from 2 to 4 PM, evening from 6 to 8 PM, and night from 9 to 11 PM. This temporal segmentation proved essential. During the morning window, most pedestrians were commuters entering or exiting the metro station, and they walked quickly with low variance, reflecting time-constrained, goal-oriented movement. After 10 AM, average speeds dropped and variability rose as shoppers, tourists, and passers-through populated the street, some browsing storefronts and others crossing directly. Around 5 PM, speeds climbed again, likely reflecting the evening commute, and after 9 PM, when most shops had closed, speed variability increased despite reduced pedestrian volumes.
Comparing emergency and non-emergency periods across these time slots produced the study’s central result. In the morning, walking speeds were generally higher during non-emergency periods, which happened to have lower temperatures, than during emergency periods with higher temperatures, suggesting that morning walking speed tracked thermal conditions more closely than policy interventions. At night, the pattern reversed: walking speeds were consistently higher during emergency periods even though temperatures were also higher, indicating that nighttime behavior responded more strongly to policy-related factors than to thermal comfort. In the afternoon and evening, neither factor consistently dominated; the influence of emergency restrictions appeared more pronounced when temperature differences between compared periods were small, and attenuated when they were large, hinting at an interaction between environmental and policy effects.
The study also examined pedestrian demographics using a secondary camera mounted 2.5 meters high, which ran NEC’s FieldAnalyst system to estimate age and gender from facial images. Because operational constraints imposed by the shopping street management limited this data collection to August 11 through December 30, 2021, and only weekdays were analyzed, the researchers emphasized that the demographic findings are indicative rather than representative of the full year. Within that subset, comparisons between an emergency period and an adjacent non-emergency period, conducted with the Mann–Whitney U test for age and chi-square tests for gender, showed no meaningful age difference in the morning. During evening and night, however, emergency conditions were associated with a younger pedestrian population, with the largest shift at night, a compositional change that may have contributed to the elevated nighttime speeds. Gender composition also shifted, but the effect sizes were small, indicating only weak associations.
Methodologically, the researchers quantified differences in walking speeds and temperatures using Cohen’s d effect sizes with Bonferroni correction for multiple comparisons, and adopted a two-sided significance threshold of p less than 0.05. All analyses were performed in Python using the Pingouin statistical package. The authors are careful to frame their conclusions as observational and correlational rather than causal: the study was not a controlled experiment, temperature co-varies with seasonal factors such as daylight duration, humidity, precipitation, and clothing, and the emergency periods coincided with reduced crowd density and broader pandemic-related changes in activity that the design cannot fully separate. The absence of pre-pandemic baseline data further prevents direct comparison with truly normal, pre-COVID pedestrian behavior, and the region-specific results may not generalize to cities with different cultural contexts or urban forms.
Despite those caveats, the study demonstrates that inexpensive, existing camera infrastructure can support scalable, real-time monitoring of public-space use and evidence-based evaluation of urban policies. Automated, continuous measurement of walking speed and demographic composition yields quantifiable indicators of how people adapt their mobility under environmental and policy stressors, complementing traditional mobility statistics without relying on strong causal assumptions. The most directly supported application is the framework itself as a low-cost monitoring and evaluation tool, one that could eventually integrate with adaptive urban management platforms. Future work, the authors suggest, should extend the approach to diverse cultural and spatial contexts, incorporate pre-pandemic baselines, examine seasonal variation, and develop predictive models that jointly capture environmental, policy, and demographic drivers of how cities move on foot.
Subject of Research: Computer-vision monitoring of pedestrian walking speeds under temperature and COVID-19 emergency policy conditions in a Japanese shopping street
Article Title: Monitoring pedestrian walking dynamics under environmental and policy influences in urban spaces
Article References: Abdelwahab, M. A., Kaji, S., Hori, M., & Takano, S. (2026). Monitoring pedestrian walking dynamics under environmental and policy influences in urban spaces. Computational Urban Science, 6(1), Article 50. https://doi.org/10.1007/s43762-026-00284-3
Image Credits: AI Generated
DOI: 10.1007/s43762-026-00284-3
Keywords: pedestrian dynamics, computer vision, YOLOv4, DeepSORT, walking speed, urban mobility, Fukuoka, State of Emergency, temperature effects, smart cities, COVID-19 policy, public space monitoring
News Source: Denise Maddox. (October 30, 2026). Cameras Reveal How Temperature and Emergency Rules Reshaped Pedestrian Walking. Scienmag.