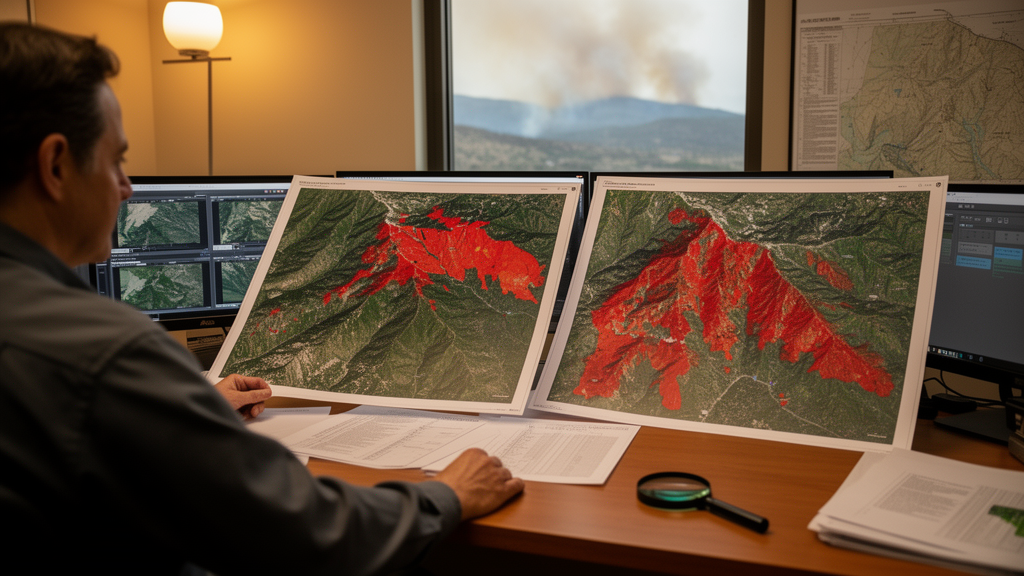
When a wildfire breaks out in early spring, the satellite image that mapmakers choose to represent conditions before the fire can change how accurately the burned landscape is classified. A new study of two large South Korean fires shows that a pre-fire image from the same season of the previous year outperformed images taken closer to ignition, and that the size of the advantage depended heavily on the machine-learning method used to draw the maps.
The research, published in Heliyon, examined the Uljin–Samcheok fire of 4–13 March 2022 and the Gangneung–Donghae fire of 5–8 March 2022, both of which burned along South Korea’s east coast. The post-fire assessment cited in the study reported roughly 16,302 hectares affected in the Uljin–Samcheok event and 4,222 hectares in the Gangneung–Donghae event. The team used imagery from PlanetScope, a commercial satellite constellation whose orthorectified products are delivered on a 3-metre grid and include red-edge and near-infrared bands well suited to tracking vegetation condition.
PlanetScope presents a specific challenge for burn-severity mapping. The standard differenced Normalized Burn Ratio relies on shortwave-infrared bands, which PlanetScope does not carry. The researchers therefore built change features from ten spectral indices calculated from the visible, red-edge, and near-infrared bands, applying both signed differences and percentage changes to produce twenty candidate predictors, from which ten were retained after screening for redundancy. Severity classes were unburned, low, and high, with polygon boundaries and labels drawn from very-high-resolution Maxar imagery viewed in Google Earth Pro, independently of the PlanetScope predictors.
The core experiment compared three pre-fire baselines, each paired with a common post-fire window of 15 March to 15 May 2022. One baseline used the same calendar window a year earlier (spring 2021), a second used the winter of 2022 shortly before ignition, and a third used the winter of 2021 as a previous-year off-season comparison. For each of the two fires, three classifiers—Random Forest, Gradient Tree Boosting, and k-nearest neighbours—were evaluated across 1000 random repetitions of sampling and train–test splitting, with a 300-metre exclusion buffer separating training from test points, yielding 18,000 run-level records in total.
The previous-year season-matched baseline produced the highest pooled test overall accuracy, 0.963, compared with 0.938 for the same-year winter baseline and 0.928 for the previous-year off-season baseline. Macro F1, which weights the three severity classes equally, followed the same ranking. The season-matched baseline also gave the most stable results, with the lowest standard deviation of test accuracy, and it achieved the highest mean accuracy in five of the six fire–classifier combinations.
That headline number, however, hides a striking asymmetry. For the two tree-based ensembles, moving from the winter baseline to the season-matched one changed mean accuracy by only 0.10 to 0.70 percentage points, and in one case—Random Forest on the Uljin–Samcheok fire—the off-season baseline was actually slightly better. The dramatic gains appeared in the k-nearest-neighbour classifier, where season matching improved mean accuracy by 9.60 percentage points in Gangneung–Donghae and 4.1 percentage points in Uljin–Samcheok relative to the winter baseline. The authors suggest this may reflect how distance-based methods are sensitive to shifts in class overlap and neighbourhood structure, although they caution that a mechanism has not been directly established.
Class-level results added further nuance. The low- and high-severity classes benefited most from seasonal matching, particularly for k-nearest neighbours, while the unburned class showed no consistent advantage across the two fires. In Gangneung–Donghae the same-year winter baseline produced the best unburned-class scores, whereas in Uljin–Samcheok the previous-year off-season baseline generally did. The authors note that low severity is especially informative because retained foliage, scorched canopy, and exposed substrate can produce mixed spectral responses within a single label, and a more comparable baseline may help discriminate among those conditions.
Explanations of the fitted models using SHAP’s PermutationExplainer showed that changes in the Burn Area Index dominated the illustrated Gangneung–Donghae fits: dBAI ranked first for Random Forest and Gradient Tree Boosting under all three baselines, and pct_BAI ranked first for k-nearest neighbours. The authors connect this prominence to the importance of red and near-infrared information for distinguishing visible fire effects, consistent with earlier work identifying near-infrared as the most influential PlanetScope band in burn-mapping experiments. The rankings of secondary predictors shifted with the baseline, and the authors stress that these attributions describe reliance within the selected fitted models rather than stable or causal effects.
The study is careful about what its accuracy numbers mean. The reference labels came from image interpretation by a single analyst, corroborated—but not calibrated—by nine Composite Burn Index field observations from Gangneung–Donghae, which ranged from 1.80 to 2.88. The reported metrics therefore measure agreement with image-interpreted labels, not quantitative field validation of canopy, understory, and soil damage. No spatially blocked or cross-fire validation was performed, and because the valid pixel coverage differed among baselines, the performance contrasts reflect the evaluated temporal inputs and their useable coverage as well as any seasonal or interannual variation. The authors also note that the advantage of season matching cannot be attributed to phenology alone, since interannual conditions, image counts, and retained coverage also differed among the baselines.
For practitioners mapping severity after early-spring fires, the message is practical rather than universal: archived season-matched imagery should be evaluated as a candidate baseline alongside temporally closer winter images, and the assessment should be repeated for the classifier actually intended for deployment, since the pooled ranking does not guarantee an equivalent gain for any single model. The findings also demonstrate that visible, red-edge, and near-infrared changes can discriminate the defined severity classes without the shortwave-infrared bands required for conventional burn-ratio indices, though the authors emphasize that no controlled comparison here establishes a resolution advantage over Landsat or Sentinel-2. Testing on additional fires and years, broader field sampling, and independent image interpretation, they conclude, are needed to determine whether the observed baseline preference transfers to new events.
Subject of Research: Temporal baseline selection for wildfire severity classification using 3 m PlanetScope imagery
Article Title: Effects of temporal baseline choice on wildfire severity mapping with 3 m PlanetScope imagery
Article References: Nguyen Van, L., Bevacqua, A. G., Huong, O. S., Kim, Y., Song, M., Choi, C., & Lee, G. (2026). Effects of temporal baseline choice on wildfire severity mapping with 3 m PlanetScope imagery. Heliyon, 12(16), Article e45624. https://doi.org/10.1016/j.heliyon.2026.e45624
Image Credits: AI Generated
DOI: 10.1016/j.heliyon.2026.e45624
Keywords: wildfire severity, PlanetScope, remote sensing, temporal baseline, South Korea, machine learning, Random Forest, k-nearest neighbours, SHAP, Burn Area Index, spectral indices, burn severity mapping
News Source: Drew Townsend. (October 27, 2026). Choosing the Right Pre-Fire Image Date Changes Wildfire Severity Maps Made from 3 m Satellite Data. Scienmag.