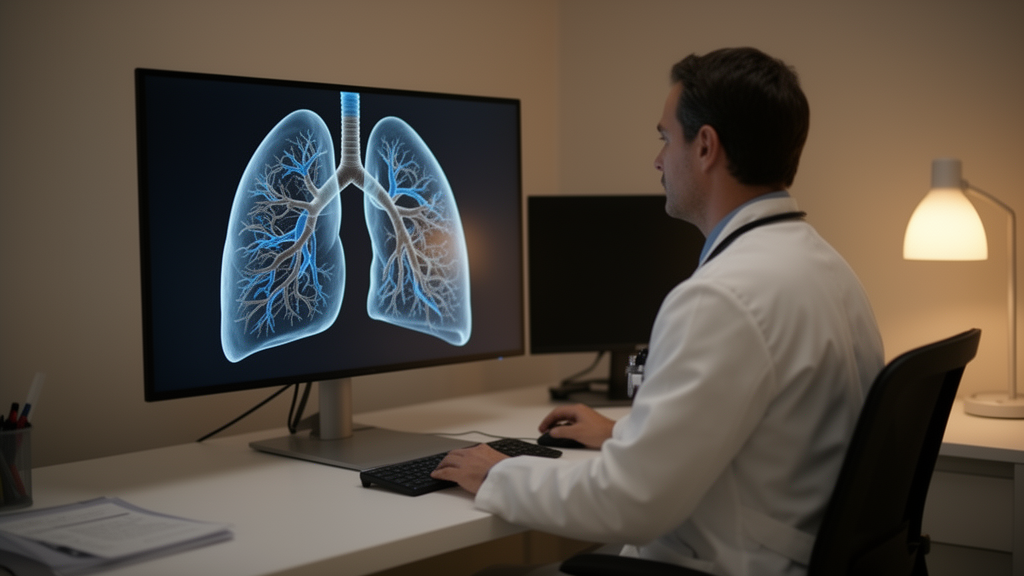
Researchers in China have built a prediction model that combines routine clinical data, blood tests, lung-function measurements and quantitative features extracted from chest CT scans to estimate an individual patient’s risk of suffering an asthma exacerbation within the next year. In a retrospective cohort of 505 adults with asthma, 72 of whom (14.3%) experienced a documented exacerbation during one year of follow-up, the ten-variable score achieved an apparent area under the receiver operating characteristic curve of 0.880, with a bootstrap-corrected estimate of 0.856. The work, published in Frontiers in Digital Health, is a development-stage study: the authors themselves stress that external validation and prospective testing are required before any clinical use.
The study was conducted at the General Hospital of Ningxia Medical University in Yinchuan, using records of patients treated between January 2020 and October 2024. From 9,687 initial records, 6,741 adults were screened and 6,236 were excluded, leaving 505 participants aged 18 or older with bronchial asthma, a baseline high-resolution CT scan and ascertainable one-year outcomes. Exclusion criteria included interstitial lung disease or other major diffusion disorders, active malignancy, severe systemic infection, major cardiovascular events within three months, and pregnancy or lactation. All 505 participants had complete one-year outcome records, ascertained through hospital electronic medical records, telephone follow-up and a regional health-information platform, with emergency visits or hospitalizations outside the study hospital additionally confirmed by telephone.
An exacerbation was defined according to GINA-based criteria as an acute or subacute worsening requiring a change in treatment, specifically one that demanded systemic corticosteroids for at least three days, an asthma-related emergency-department visit, or an asthma-related hospitalization. The investigators reviewed records retrospectively using the 2025 GINA diagnostic criteria, although this was a retrospective diagnostic assessment rather than an application of the 2025 guideline during the original clinical encounters. The median age of the cohort was 49 years and 61.2% of participants were female; age, sex, weight, height and body mass index were broadly similar between patients with and without exacerbation.
The most distinctive element of the model is what the authors call a static baseline CT digital-twin framework. Baseline noncontrast high-resolution CT was acquired during inspiration on a 256-slice scanner, and commercial software segmented the tracheobronchial tree, lung parenchyma and pulmonary vasculature, generating a patient-specific three-dimensional baseline representation linked to a fixed probability score. The authors are explicit that this implementation does not simulate physiology, update dynamically or provide bidirectional feedback; the term digital twin here denotes a static, patient-specific baseline representation rather than a continuously synchronized computational model. Two radiologists with ten years of thoracic imaging experience each, blinded to outcomes, jointly reviewed all 505 segmentation results, and no case required manual correction. The authors note that this joint review supports quality control but does not quantify inter-reader agreement, repeated-segmentation reproducibility or scan-rescan repeatability.
Model development used least absolute shrinkage and selection operator (LASSO) regression with five-fold tuning and the lambda-1SE rule, retaining ten predictors: disease duration, vital capacity percent predicted, forced vital capacity percent predicted, total lung capacity percent predicted, diffusing capacity for carbon monoxide percent predicted, white blood cell count, the combined count of blood leukocyte subgroups other than neutrophils and lymphocytes (termed MXD), total IgE, pulmonary artery volume, and maximum venous density in Hounsfield units. Notably, no single predictor achieved an area under the curve above 0.700; the highest single-variable discrimination came from disease duration at 0.692, while IgE was weakest at 0.592. The composite score’s strength lay in combining modest signals across clinical, laboratory, physiologic and imaging domains.
Several baseline characteristics differed between patients who did and did not exacerbate. Those with exacerbations had longer disease duration, with a median of 3.0 years versus 1.0 year, and chronic obstructive pulmonary disease was more frequent in the exacerbation group at 25.0% versus 12.2%. Cough-variant asthma was less common among patients who exacerbated, and the smoking-status distribution also differed between groups. Patients with exacerbations showed lower vital capacity, forced vital capacity, FEV1 percent predicted, FEV1/FVC ratio, peak expiratory flow and diffusing capacity, along with higher total lung capacity percent predicted, a pattern the authors interpret as potentially reflecting hyperinflation or air trapping. Inflammatory markers also differed: white blood cell count, neutrophil count, MXD, basophil count and IgE were higher among those who exacerbated, while eosinophil count showed only a borderline difference and lymphocyte count was similar between groups. Medication differences, such as more frequent LABA use and less frequent methylxanthine use among those who exacerbated, may reflect confounding by indication and cannot be interpreted as treatment effects.
Validation results were reported with careful caveats. The apparent area under the curve of 0.880 came with a conditional bootstrap 95% confidence interval of 0.836 to 0.917 and a Brier score of 0.086. Fixed-predictor bootstrap correction, which does not repeat the original LASSO variable-selection step, yielded an area under the curve of 0.856, a calibration slope of 0.875, an intercept of −0.182 and a Brier score of 0.094. An exploratory selection-resampling analysis using an alternative Python implementation showed a mean apparent-versus-original-cohort area under the curve difference of 0.086, which the authors caution must not be interpreted as an exact optimism correction for the original model. At a risk threshold of 0.10, apparent sensitivity was 86.1% and specificity 76.2%, with a positive predictive value of 37.6% and a negative predictive value of 97.1%.
The contribution of the CT variables proved comparator-dependent. In a fully nested comparison, adding CT features to a model already containing clinical, laboratory and pulmonary-function variables raised the apparent area under the curve from 0.880 to 0.894, an increment of 0.013 with a confidence interval spanning zero and a likelihood-ratio P value of 0.070, not statistically significant. In a separate, restricted available-variable comparator, adding CT raised the area under the curve from 0.725 to 0.774, a difference of 0.049 that was statistically significant at P less than 0.001, although the corresponding Brier-score improvement interval included zero. The authors emphasize that neither comparison establishes improved out-of-sample performance and that the CT contribution remains exploratory and dependent on which comparator is used.
The two CT vascular variables deserve particular scrutiny. Artery volume and maximum venous density are quantitative associations in the fitted score, not demonstrated biological mechanisms; vascular remodeling, perfusion and histopathology were not directly measured. All baseline scans were noncontrast, and although voxel-level review of the extreme maximum venous-density values confirmed the recorded measurements with no measurement error identified, maximum venous density remains an attenuation descriptor rather than a direct measure of blood flow. Its observed range was 117 to 3,258 Hounsfield units, with 276 of 505 values exceeding 500 HU. Replacing maximum with mean venous density yielded an apparent area under the curve of 0.874, a sensitivity analysis that does not establish physiological validity. A sensitivity analysis restricted to the 434 participants without recorded COPD, among whom 54 events occurred, yielded an apparent area under the curve of 0.878.
The authors position the work within a broader research landscape, citing cohorts such as SARP, U-BIOPRED, COPDGene, SPIROMICS and ECLIPSE that have linked asthma phenotypes to inflammatory, molecular and imaging features, while noting that their own cohort lacked comparable molecular profiling and formal overlap-phenotype adjudication. They also stress that their available-variable comparator shares only some predictor categories with the published RESA severe-asthma risk model and is neither a reconstruction nor an external validation of it. A web-based calculator exists as a research demonstration but carries a prominent warning that the model is intended for research use only and has not been externally validated, and the authors state it should not guide individual treatment decisions. If the score is externally validated, the authors suggest it could be studied as an aid to risk-informed follow-up, inhaler-technique review, adherence assessment or treatment discussions, but they frame these as hypotheses for prospective evaluation rather than demonstrated clinical uses. Future work, they write, should validate the full modeling procedure in external cohorts, assess quantitative CT repeatability through repeated segmentation and scan-rescan studies, and evaluate prospective clinical impact, potentially extending the static framework toward a conventional dynamic digital twin by adding longitudinal imaging, physiological and clinical data with defined updating and feedback mechanisms.
Subject of Research: Multimodal risk prediction of one-year asthma exacerbations using a static baseline CT digital-twin framework
Article Title: Multimodal prediction of documented 1-year asthma exacerbation risk incorporating a static baseline CT digital-twin framework: a retrospective cohort study
Article References: Xie, M., Jin, X., Wang, S., Yu, H., Cheng, J., Wang, S., Zhang, Y., Guo, X., Li, J., Li, H., Wang, H., & Yang, X. (2026). Multimodal prediction of documented 1-year asthma exacerbation risk incorporating a static baseline CT digital-twin framework: a retrospective cohort study. Frontiers in Digital Health, 8, Article 1935315. https://doi.org/10.3389/fdgth.2026.1935315
Image Credits: AI Generated
DOI: 10.3389/fdgth.2026.1935315
Keywords: asthma, exacerbation prediction, CT digital twin, quantitative CT, LASSO logistic regression, retrospective cohort, risk prediction model, pulmonary function, IgE, nomogram, health informatics, Multimodal
News Source: Ophelia Keating. (October 26, 2026). CT-based digital twin score predicts one-year asthma exacerbation risk in retrospective study. Scienmag.