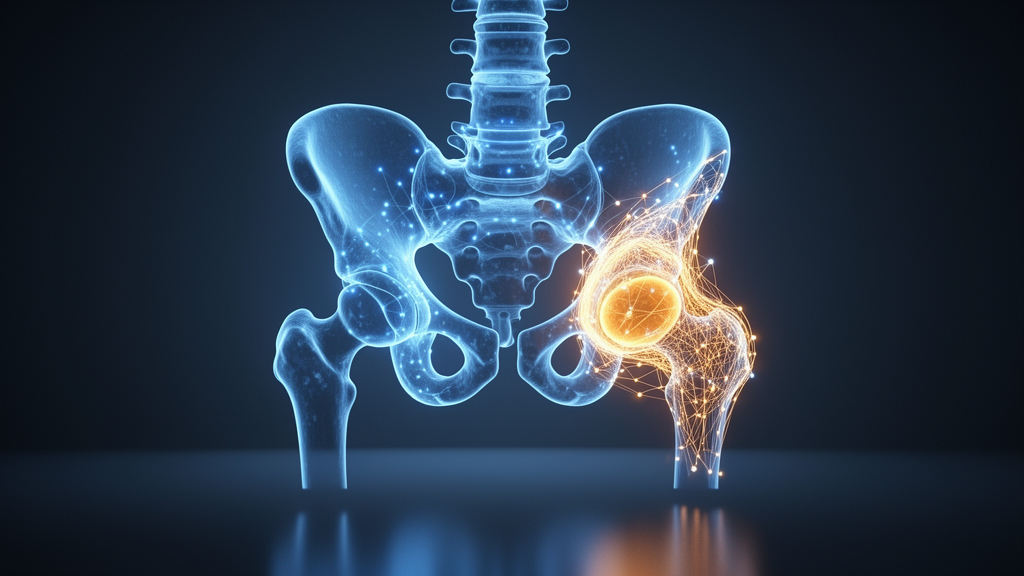
Deep learning has now peered inside nearly five thousand human hips, and what it found could reshape how scientists think about one of the most common degenerative conditions in the world. In a study published in the Annals of Biomedical Engineering, researchers in the Netherlands developed and validated a fully automated, MRI-based method for analyzing hip joint anatomy in three dimensions, applying it to 2,454 young adults from the Generation R Study in Rotterdam. The result is the first large-scale population reference atlas of 3D hip morphology in young adults, built not from a handful of expert measurements but from thousands of standardized, machine-generated anatomical maps.
The clinical motivation is stark. In Europe, people face roughly a 25 percent lifetime chance of developing hip osteoarthritis, a condition that drives disability, diminished quality of life, and escalating healthcare costs. Acetabular dysplasia, a structural abnormality in which the hip socket fails to adequately cover the femoral head, is recognized as one of the strongest known risk factors for early degenerative changes. Because early detection of such abnormalities could significantly alter disease progression, particularly in young adults, the research team set out to close a conspicuous gap: there are essentially no reference data for three-dimensional hip morphology in this age group, since population studies have focused almost exclusively on older adults.
The technical foundation of the study is an nnU-Net deep learning model, a self-configuring convolutional neural network architecture that has become a benchmark for biomedical image segmentation. The model was trained on just 40 manually segmented hips, drawn from 20 randomly selected participants with equal representation of males and females, using 5-fold cross-validation with both 2D and 3D full-resolution configurations ensembled across folds and then across configurations. Each fold was trained for 1,000 epochs. The model’s inputs were the water-only and in-phase images from a Dixon LavaFlex sequence acquired on a 3 Tesla MRI scanner, with an in-plane resolution of 0.89 by 0.89 square millimeters and a slice thickness of 1.2 millimeters. From these images, the network automatically segmented four key structures in each hip: femoral bone, acetabular bone, femoral cartilage, and acetabular cartilage.
Performance was impressive for bone and respectable for cartilage. On a hold-out test set of 10 hips, the model achieved Dice similarity coefficients of 0.97 for femoral bone, 0.90 for acetabular bone, 0.77 for acetabular cartilage, and 0.77 for femoral cartilage, with mean surface distances smaller than a single voxel for all structures. The femoral bone score matches the highest reported values in the literature for MRI-based bone segmentation. The acetabular bone score is lower, likely because the acetabulum lacks a clear anatomical boundary, requiring the model to learn not only relevant image features but also where segmentation should end. Cartilage segmentation is inherently harder because hip cartilage is thin and vulnerable to partial volume effects, though the authors note that previous studies achieving higher scores often treated cartilage as a single entity rather than separately segmenting femoral and acetabular components as this method does.
Once segmentations were complete, the team extracted a battery of quantitative imaging biomarkers in five categories: basic geometric metrics, cartilage volumes, angular measurements, coverage metrics, and joint space width. The extraction pipeline used Python with the Visualization Toolkit, beginning with discrete marching cubes surface extraction followed by windowed sinc smoothing to eliminate voxelation artifacts. Random sample consensus fitting located the femoral head and acetabular fossa as spheres, while least-squares fitting defined the femoral shaft axis. The femoral head-neck axis was defined by expanding the fitted head sphere by 40 percent, a proportion demonstrated to be the most robust approach, and fitting a circle to the resulting neck cross-section. Acetabular rim extraction used a best-fitting projection plane, 2D Delaunay triangulation, and convex hull refinement. The acetabular clockface was established in 30-degree increments using the acetabular fossa direction vector, the midpoint of the acetabular notch, and the femoral head center.
Coverage metrics quantified how much of the femoral head is overlaid by the acetabular fossa, calculated as whole coverage, upper coverage, and quarter-region coverage defined by planes aligned with the femoral neck axis. Joint space width was measured as mean and minimum values over a region of interest in the acetabular fossa, selected through distance-based Otsu thresholding, and subdivided into eight sections for regional analysis. Alpha angles, which assess femoral head-neck junction morphology, were calculated by projecting the segmented femur onto coronal and axial planes and identifying where the projected surface deviated from a fitted circle by more than 2 millimeters. In total, the pipeline computed 37 biomarkers per hip, all from the segmentation masks alone.
Quality control was layered throughout. An automated check confirmed that each hip segmentation formed a single connected component and that left and right labels were correctly assigned, with incorrect labels automatically swapped and multi-component segmentations excluded. Cases with biomarker values more than 2 standard deviations from the mean were visually reviewed to catch segmentation errors the automated checks missed. A sensitivity analysis on 40 hips simulated two common segmentation deficiencies, incomplete acetabular fossa segmentation and under-segmentation at the cup edges, and found that most biomarkers remained stable, with only tilt and version showing notable shifts. The overall exclusion rate was just 1.8 percent, underscoring the robustness of the automated approach.
The population-level findings are striking. Females had smaller femoral and acetabular radii, reduced cartilage volumes on both femoral and acetabular sides, smaller alpha angles in both coronal and axial planes, and greater acetabular version compared to males. Interestingly, femoral cartilage volume differed significantly between sexes, but the normalized femoral cartilage volume did not, suggesting that normalization by the squared femoral head radius effectively removes size dependency. BMI-related differences were generally small in magnitude, with effect size analysis indicating that statistical significance may partly reflect the large sample size rather than substantial differences. After stratifying by sex, some BMI differences lost significance, and males showed highest cartilage volumes in the normal weight group while females showed a more consistent increase in normalized cartilage volumes with higher BMI.
Correlation analyses revealed coherent relationships among biomarkers. Coverage measurements showed consistent positive correlations with each other, with upper coverage particularly strongly correlated with the 12 o’clock coverage angle at r equals 0.85. Joint space width measures were inversely correlated with coverage, with whole coverage, upper coverage, and the 12 o’clock angle all showing negative correlations with mean and minimal JSW, and a moderate negative association of r equals negative 0.5 between coverage and mean JSW that aligns with previous findings. Tilt and version correlated with coverage angles in ways consistent with their definitions of acetabular orientation. Regional JSW analysis showed that anterior values were consistently larger than posterior values, and strong correlations between overall minimal JSW and regional values in specific areas demonstrated the value of spatially resolved joint space mapping.
The study’s reference values, reported as percentiles for each biomarker, provide a framework for research and exploratory clinical analysis rather than diagnostic thresholds. The authors emphasize that these values are not intended for identifying hip dysplasia or femoroacetabular impingement, and that the relationship between these 3D biomarkers and clinical outcomes remains unknown. Future work should validate them by correlating with clinical assessments, radiographic disease markers, and patient-reported outcomes, both cross-sectionally and longitudinally. Because the biomarkers are calculated from segmentation masks, the method can be applied to other 3D imaging modalities including CT, supporting broader use in research and clinical practice. The authors propose a minimal subset of biomarkers, including normalized cartilage volumes, whole coverage, and regional joint space width measures, as the most promising starting point. All developed code and model weights are openly available, and the standardized approach could be used to investigate morphological changes in longitudinal studies of hip osteoarthritis progression, assess pre- and post-operative changes in hip morphology, and support surgical planning and outcome evaluation.
Subject of Research: Automated 3D Analysis of Hip Morphology in a Young Adult Population
Article Title: Automated 3D Analysis of Hip Morphology in a Young Adult Population
Article References: Kamphuis, M. A., Oei, E. H. G., Runhaar, J., Hanff, D. F., Tolk, J. J., Agricola, R., Bierma-Zeinstra, S. M. A., Klein, S., & Hirvasniemi, J. (2026). Automated 3D Analysis of Hip Morphology in a Young Adult Population. Annals of Biomedical Engineering. https://doi.org/10.1007/s10439-026-04418-w
Image Credits: AI Generated
DOI: 10.1007/s10439-026-04418-w
Keywords: deep learning, hip morphology, MRI segmentation, nnU-Net, osteoarthritis, Generation R cohort, biomedical engineering, Automated, Analysis, Morphology, Young, Adult
News Source: Blake Davidson. (October 16, 2026). AI Reads the Hip in 3D: Deep Learning Maps Joint Anatomy in Nearly 2,500 Young Adults. Scienmag.