For millions of American households, the electricity bill is not just a monthly annoyance but a genuine financial strain. Researchers call this the energy burden: the share of income a family must devote to keeping the lights on. Now a team at the National Laboratory of the Rockies, formerly known as the National Renewable Energy Laboratory, has produced one of the most detailed attempts yet to answer a deceptively simple question: where in the United States could small, locally sited wind turbines do the most good for the people struggling the most? The study, published in the journal Wind Energy Science, combines parcel-level wind resource modeling with county-level economic and demographic data to build a prioritization framework for distributed wind deployment.
Distributed wind differs fundamentally from the vast turbine arrays that dominate the American landscape. Wind supplied nearly 11 percent of United States electricity generation in 2024, but almost all of that came from utility-scale farms feeding the high-voltage transmission grid. Distributed wind, by contrast, refers to turbines installed at or near the point of demand: a single machine behind a farmhouse, a turbine serving a campus, or a small cluster powering an industrial facility. These systems typically stand on hub heights between 30 and 80 meters and can operate behind the meter, offsetting retail electricity purchases directly, or in front of the meter, feeding the local distribution grid. The new study focuses exclusively on behind-the-meter applications, where the economics are most directly tied to household savings.
The analytical backbone of the work is the Distributed Wind Energy Futures Study, a multi-year modeling effort that evaluates nearly 150 million land parcels across the contiguous United States. The model incorporates land use, siting constraints, electricity demand, wind resource availability, and policy context to size hypothetical systems and simulate their annual energy production. Crucially, it also filters for economic viability, using indicators such as net present value, payback period, and threshold capital expenditure, the maximum system cost at which a project still makes financial sense. The result is not a deployment forecast, the authors stress, but a spatially consistent map of where cost-viable wind potential actually exists, parcel by parcel.
To connect that technical potential with human need, the researchers built a set of affordability metrics. The core measure is the energy burden, calculated at the county level as total residential electricity expenditure divided by the product of median household income and the number of residential units. Because energy burden can produce distorted or infinite values for households with near-zero income, the team paired it with the net energy return, an algebraic transformation that remains interpretable across the full income range. They also extended the framework to the macroeconomic scale, comparing county energy expenditure to gross domestic product. Since distributed wind only displaces electricity, not natural gas or heating fuels, the team calculated burden from electricity spending alone and defined extreme values using state-specific distributions rather than national thresholds.
The geographic picture that emerges is strikingly uneven. Southeastern states show above-median residential energy burdens, with Alabama recording the highest median burden in the nation in both the 2025 and 2035 scenarios, followed closely by South Carolina and Georgia in the share of counties exceeding the 90th percentile. Many western states, meanwhile, fall below the national average. Yet the county-level maps reveal substantial variation within states, meaning state averages can obscure pockets of deep energy stress. The distributions are slightly right-skewed, with a median around 1.7 percent for electricity-only burden, lower than commonly cited figures that include all energy sources, but the spatial clustering of the worst-hit counties is unmistakable.
The study’s central methodological innovation lies in how it matches need with opportunity. The researchers normalized wind generation potential by local electricity demand, producing an AEP-to-demand ratio that accounts for the fact that a strong wind resource means little if local consumption is enormous. They then computed correlations between this demand-adjusted potential and energy burden for every state, using both parametric Pearson correlations on Box-Cox-transformed data and the nonparametric Kendall’s tau. Strong correlations appear only where two conditions coincide: high distributed wind potential and high energy burden in the same counties. That spatial alignment, the team argues, is the true signal of deployment opportunity, and it is far from uniform across the country.
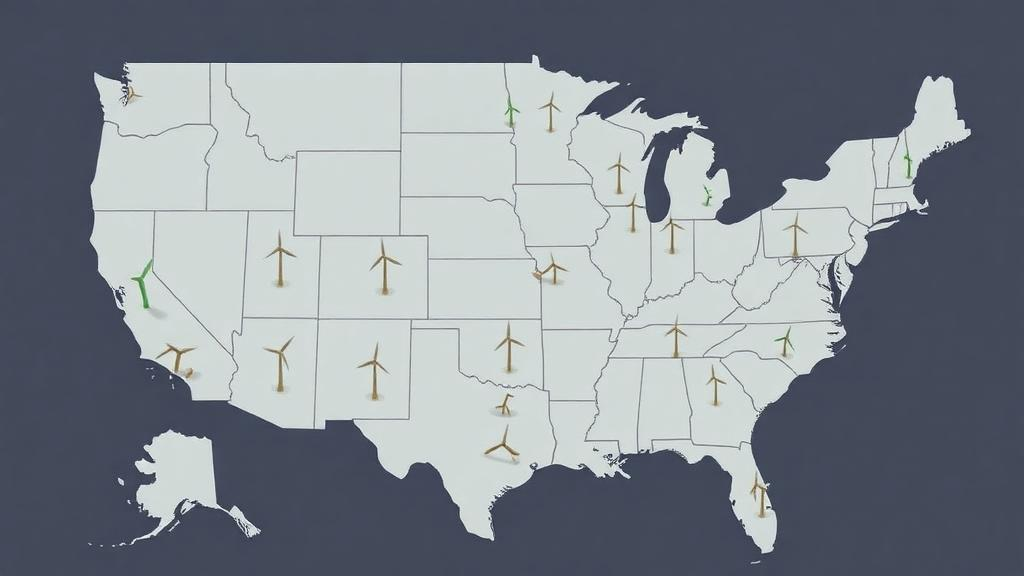
Grouping states by this alignment produced two distinct categories and two special cases. Group 1, the highest-priority states, includes North Carolina, Georgia, Iowa, Louisiana, and California, where counties with high energy burden systematically overlap with counties offering relatively greater wind opportunity. Louisiana is particularly instructive: it ranks only 28th in residential demand-adjusted potential and 32nd in total generation, yet it exhibits one of the strongest burden-potential correlations nationally, meaning the limited wind resource it does have is geographically well matched to need. Group 2, comprising Wisconsin, Minnesota, and Kansas, shows abundant wind potential but comparatively low energy burden, making these states better candidates for broader economic development than direct affordability relief. Texas and Alabama emerge as special cases: Texas has enormous total potential diluted by vast demand and near-zero spatial correlation with burden, while Alabama combines the nation’s highest energy burden with only moderate wind alignment.
Beneath the spatial analysis sits a statistical question: what drives energy burden in the first place? Using linear mixed-effect models with states as random effects, the team found that poverty rate and agricultural employment are both significantly and positively associated with higher energy burden. The state-level random effect accounted for roughly 40 percent of the total variance, confirming that policy, regulation, climate, and pricing structures create deep interstate differences. Separate fixed-effect regressions for representative states from each group reinforced the pattern, consistently identifying poverty and agricultural employment as key covariates. The authors are careful to note that these are associations, not causal claims, and that agricultural employment likely serves as a proxy for broader rural disadvantage, including lower and more variable incomes, older housing stock, and limited access to utility assistance programs.
The implications extend beyond electricity bills. Prior research has suggested that renewable energy development, wind in particular, can deliver local economic benefits through job creation and increased tax revenues, yet those benefits often fail to reach the communities most affected by high energy costs. Distributed wind’s low relative cost, its ability to be sized to match demand, and its potential for local employment make it a plausible tool for easing energy hardship, particularly in rural and agricultural regions where the study finds the strongest associations. Roughly 16 percent of United States households experience energy poverty according to earlier work, with higher prevalence among Black, Hispanic, and Native American communities, giving the prioritization framework an explicit equity dimension.
The researchers also flag important caveats. The modeled economics assume a federal investment tax credit equal to 30 percent of project capital expenditures along with location-dependent bonuses for energy communities, low-income communities, and tribal lands, incentives whose availability was expected to narrow after federal policy changes in 2025, which would reduce cost-viable potential across all states. The analysis does not account for permitting constraints, utility structures, financing availability, or technology adoption barriers, all of which shape real deployment outcomes. And correlation, however strong, does not guarantee savings: communities with high burdens may find wind projects unaffordable without suitable financing, even when long-term economics are favorable. The authors call for future work on parcel-level resource sufficiency, realistic bill-savings quantification, and the integration of co-benefits such as emissions, air quality, wildlife, and land-use impacts. For now, the framework offers state and county decision-makers something they have largely lacked: a transparent, reproducible way to identify where a modest turbine on a local horizon might do the most measurable good.
Subject of Research: Spatial and economic prioritization of distributed wind energy deployment to alleviate residential energy burden in the United States
Article Title: Spatial and economic prioritization for distributed wind
Article References: Spatial and economic prioritization for distributed wind. (n.d.). https://doi.org/10.5194/wes-11-3785-2026
Image Credits: AI Generated
Keywords: distributed wind, energy burden, energy poverty, wind energy, energy affordability, rural energy, spatial analysis, renewable energy, energy economics, behind-the-meter, wind siting, United States
News Source: Faith Mcneil. (October 8, 2026). New Map Shows Where Small Wind Turbines Could Ease America’s Energy Burden. Scienmag.