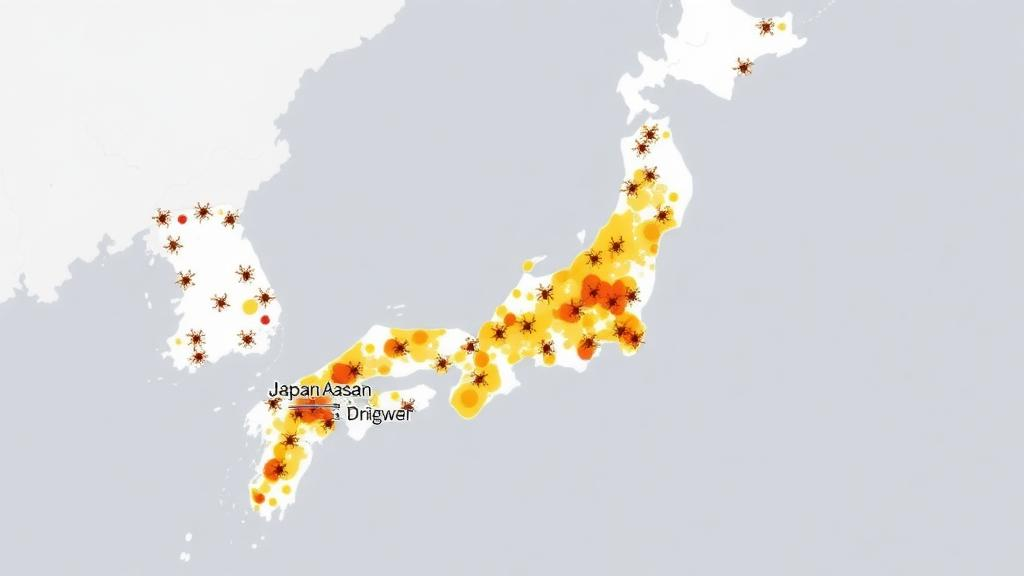
A tick bite in a Japanese forest can transmit more than an itch. Depending on where you stand in the archipelago, the same blood-feeding arachnid may carry Lyme disease, Japanese spotted fever, severe fever with thrombocytopenia syndrome, tick-borne encephalitis, or relapsing fever. Yet until recently, no one had a comprehensive, nationwide picture of which tick species live where. A new study published in Parasites & Vectors by Mebuki Ito, Keita Matsuno, Ryo Nakao, and colleagues at Hokkaido University and partner institutions has now filled that gap, combining one of the largest tick surveys ever conducted in Japan with cutting-edge species distribution modeling to produce high-resolution maps of sixteen tick species and to link those maps directly to the geography of human disease.
The scale of the underlying field effort is remarkable. Between 2013 and 2025, members of the Hokkaido University Tick Hunting Team, joined by collaborators across the country, systematically dragged cloth flags through vegetation at 1,018 sites spanning 38 of Japan’s 47 prefectures. This flagging method, the standard technique for sampling host-seeking ticks, involves pulling a white cloth square across low vegetation so that questing ticks latch onto it. The surveys yielded a total of 22,416 individual ticks, representing the sixteen species that formed the basis of the modeling work. Because tick distribution data have historically been restricted to localized studies, this dataset provides an unusually broad and consistent foundation for predicting where each species can persist across the entire Japanese archipelago.
To transform field observations into predictive maps, the team employed the maximum entropy method, widely known as Maxent, a machine-learning approach that estimates the probability of species presence from occurrence records and environmental variables. The models incorporated three categories of predictors: climatic variables such as temperature and precipitation, topographic features such as elevation, and landscape variables describing land cover and habitat type. The resulting predictions were generated at a resolution of one square kilometer, fine enough to distinguish habitat suitability between neighboring valleys or forest patches. Model performance was robust across the sixteen species, giving the researchers confidence that the maps capture genuine ecological patterns rather than statistical noise.
Among all the environmental variables tested, one emerged with unexpected prominence: snow depth. For six of the sixteen tick species, snow depth contributed the largest share of explanatory power in the models. This finding carries real ecological weight. Deep, persistent snow insulates the ground layer where ticks overwinter, moderating the extreme cold that would otherwise kill them, but it also shapes the length of the active season and the structure of the vegetation communities ticks depend on. In a country that stretches from subtropical Okinawa to the frigid northern island of Hokkaido, snow depth turns out to be a fundamental determinant of where ticks can establish populations, and by extension, where the pathogens they carry can circulate.
The predicted suitable habitats showed striking interspecific variation, following both latitudinal and elevational gradients. Some species are confined to the cool, snowy north, while others thrive in the warmer south; some occupy lowland forests, others climb into mountain terrain. This diversity of distribution patterns matters because each tick species is a competent vector for a different set of pathogens. A map that lumps all ticks together would obscure precisely the spatial structure that determines which diseases threaten which communities. The new species-by-species approach reveals that patchwork in detail for the first time.
The most consequential step of the analysis went beyond mapping habitats and asked whether the predicted distributions actually explain where human cases of tick-borne disease occur. The researchers converted their one-kilometer probability maps into prefecture-level statistics, calculating for each of Japan’s prefectures the proportion of grid cells predicted to be occupied by each tick species. They then used regression analyses to test whether these occupancy proportions could account for the reported numbers of five notifiable tick-borne diseases: severe fever with thrombocytopenia syndrome, tick-borne encephalitis, Japanese spotted fever, Lyme disease, and relapsing fever. The answer was a clear yes, with significant correlations between the predicted area occupied by suspected vector species and the reported case counts for each disease.
The species-disease alignments were biologically coherent in ways that strengthen confidence in the results. For diseases with a predominantly northern distribution, such as Lyme disease, the predicted distributions of Ixodes pavlovskyi and Ixodes persulcatus aligned closely with reported case occurrence, and both species are known vectors of the Borrelia bacteria that cause the illness. At the opposite end of the map, Haemaphysalis flava emerged as the primary contributor to model performance for Japanese spotted fever and the secondary contributor for severe fever with thrombocytopenia syndrome, two diseases concentrated in southern and western Japan. Again, the correlated species are recognized vectors of the corresponding pathogens. In other words, the models did not merely find statistical associations; they recovered the known vector ecology of each disease from environmental data alone.
This external validation against disease surveillance data is what elevates the study from a biogeographic exercise to a practical public health tool. Species distribution models are often evaluated solely on their ability to reproduce the occurrence records used to build them, which risks circularity. By demonstrating that independently collected human disease reports track the predicted tick distributions, the researchers provided evidence that the maps capture something real about transmission risk on the ground. For public health authorities, this means the maps can serve as an early-warning layer, highlighting prefectures where environmental conditions favor vector species even before cases accumulate.
The implications extend beyond Japan’s borders. Climate change is expected to shift temperature and snowfall patterns across temperate Asia, and because snow depth proved to be such a powerful predictor, changes in snow cover could redraw the boundaries of tick habitat in the coming decades. Species currently confined to Hokkaido’s snowy forests might expand southward or upslope, carrying tick-borne encephalitis and other northern diseases into new territories. Conversely, warming could compress the suitable habitat of cold-adapted species. The modeling framework established in this study, with its one-kilometer resolution and multi-species coverage, provides a baseline against which such shifts can be measured and anticipated.
The study also demonstrates the value of sustained, collaborative fieldwork. Twelve years of surveys, involving dozens of students and researchers in the Hokkaido University Tick Hunting Team and partner laboratories from Kitasato University, the University of Tokyo, the University of Osaka, and beyond, produced the occurrence data that no amount of modeling ingenuity could substitute for. The authors note that the resulting maps, offering a nationwide overview of tick distributions, serve as basic information for anticipating the occurrence of tick-borne diseases in the region. For clinicians, the maps offer context for differential diagnosis when patients present with fever after outdoor exposure; for epidemiologists, they provide a spatial framework for surveillance prioritization; and for the public, they offer a clearer picture of the invisible landscape of risk that accompanies a walk through Japan’s forests and grasslands.
Subject of Research: Species distribution modeling of tick vectors and tick-borne disease occurrence in Japan
Article Title: Predicting the distribution of 16 tick species in Japan and its association with the occurrence of tick-borne diseases
Article References: Ito, M., Ohari, Y., Ohsugi, Y., Taya, Y., Hayashi, N., Ogata, S., Kusakisako, K., Qiu, Y., Nonaka, N., Mizuma, K., Torii, S., Kajihara, M., Hokkaido University Tick Hunting Team (HUT-HuT), Mimura, Y., Regilme, M. A. F., Thu, M. J., Kovba, A., Kwak, M., Teo, E., … Nakao, R. (2026). Predicting the distribution of 16 tick species in Japan and its association with the occurrence of tick-borne diseases. Parasites & Vectors. https://doi.org/10.1186/s13071-026-07717-2
Image Credits: AI Generated
DOI: 10.1186/s13071-026-07717-2
Keywords: ticks, species distribution modeling, Maxent, Japan, Lyme disease, severe fever with thrombocytopenia syndrome, Japanese spotted fever, tick-borne encephalitis, snow depth, vector ecology, public health, Ixodes
News Source: Phoebe Ingram. (October 6, 2026). Nationwide Tick Map Reveals How Snow Depth Shapes Disease Risk Across Japan. Scienmag.