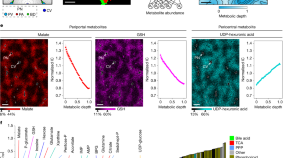

Among the strongest spatial enzyme gradients in the mouse liver is periportal localization of the glutamine catabolic enzyme glutaminase (Extended Data Fig. 8b,c). Consistent with such localization, we observed increased labelling of both glutamate and malate from glutamine periportally (Fig. 3a,b and Extended Data Fig. 8c,d). Glutamine resynthesis from glutamate was pericentral, consistent with the enzyme glutamine synthetase (Fig. 3a,b and Extended Data Fig. 8c). TCA labelling from lactate was more modestly periportal (Fig. 3a,b). Lactate enters the TCA cycle via pyruvate through two different routes. Oxidative catabolism to acetyl-CoA through pyruvate dehydrogenase generates M+2 TCA intermediates and supports TCA turning and energy generation (Fig. 3a). By contrast, pyruvate carboxylation to oxaloacetate generates M+3 TCA intermediates (Fig. 3a,b). These can either feed gluconeogenesis or be converted into M+2 TCA intermediates by TCA turning (Fig. 3a,b). Thus, the malate M+3/M+2 ratio reflects pyruvate carboxylase flux relative to TCA turning. Consistent with gluconeogenesis being periportal, the malate M+3/M+2 ratio was greater periportally (Extended Data Fig. 8f–h). Tracing with [1-13C]lactate, which selectively labels malate made through pyruvate carboxylase, further supported periportal localization of pyruvate carboxylase activity (Extended Data Fig. 8i). Overall, these tracing data confirmed expected periportal localization of both gluconeogenesis and glutamine catabolism, as well as the expected pericentral localization of glutamine resynthesis from glutamate.
Fig. 3: Spatial variation in metabolic activity revealed by isotope-tracer infusions. a, Schematic of labelled glutamine ([13C5,15N2], M+5+2) and lactate ([13C3], M+3) metabolism in liver. M+5+2 glutamine can be metabolized to M+5+1 glutamate (green), which can be reamidated to M+5+1 glutamine (magenta). Lactate oxidation generates M+2 malate (red). Anaplerosis (pyruvate carboxylation) produces M+3 malate (yellow). The circles indicate carbon atoms. The triangles show nitrogen atoms. Filled shapes (black and coloured) represent isotope labelled. AKG, α-ketoglutarate; oxal, oxaloacetate. b, Merged liver MALDI images of M+2 (red) and M+3 (yellow) malate from [13C3]lactate infusion (2.5 h, around 40% serum enrichment) (left image). The veins are outlined in grey and interiors are excluded. Left graph, M+2 and M+3 malate fractions after correction for circulating tracer fractional enrichment. Data are mean ± s.e.m. n = 4 mice. Right image, merged liver MALDI images of M+5+1 glutamate (green) and M+5+1 glutamine (magenta) from [13C5,15N2]glutamine tracing (2.5 h, around 40% serum enrichment). Right graph, the M+5+1 glutamate to M0 glutamate ratio (green) and the M+5+1 glutamine to M0 glutamine ratio (magenta) after correcting for circulating tracer fractional enrichment. Data are mean ± s.e.m. n = 6 mice. Images were collected at a 20-µm spatial resolution. Scale bars, 500 µm. c, Schematic as in a, but for the small intestine. d, MALDI image of M+2 glutamate (red) in the small intestine from [13C3]lactate tracer infusion as in b (left image). C18:2 (blue) marks villi. Owing to a higher spatial resolution, only glutamate labelling shows sufficient signal and was used as a TCA readout (glutamate and TCA intermediate α-ketoglutarate are in rapid exchange). Left graph, the M+2 glutamate fraction after correction as in b. Data are mean ± s.e.m. n = 3 mice. Right image, MALDI image of M+5 glutamate (green) in the intestine from [13C5,15N2]glutamine infusion as in b. Right graph, M+5 glutamate fraction after correction as in b. Data are mean ± s.e.m. n = 2 mice. Intestine images were collected at a spatial resolution of 10 µm. Scale bars, 200 µm.Source Data
In the intestine, we were particularly interested in whether isotope tracing could shed light on the differential localization of malate (tips) and citrate (crypts). Citrate synthesis from malate involves two enzymatic reactions: malate oxidation to oxaloacetate followed by addition of a two-carbon unit from acetyl-CoA, typically coming from glucose, lactate or fat oxidation (Fig. 3c). As both of these steps from malate to citrate depend on oxidative capacity, they logically might be hindered in the less-well-perfused villus tips. If this were the case, we would expect the TCA cycle to be fed through oxidative lactate metabolism (M+2 TCA intermediates from lactate) preferentially in the crypts and for the major alternative fuel, glutamine, to predominate at the tips (Fig. 3c). Indeed, we observed preferential lactate contribution to intestinal glutamate in the crypts and glutamine contribution in the villus tips (Fig. 3d). The dual sources of glutamate further align with its dual crypt-tip localization (Extended Data Fig. 6d). Thus, TCA fuel use varies spatially in both the liver and intestine and helps to explain observed metabolite concentration gradients.
Samarah, L.Z., Zheng, C., Xing, X. et al. Spatial metabolic gradients in the liver and small intestine.
Nature (2025).
bu içeriği en az 2000 kelime olacak şekilde ve alt başlıklar ve madde içermiyecek şekilde ünlü bir science magazine için İngilizce olarak yeniden yaz. Teknik açıklamalar içersin ve viral olacak şekilde İngilizce yaz. Haber dışında başka bir şey içermesin. Haber içerisinde en az 12 paragraf ve her bir paragrafta da en az 50 kelime olsun. Cevapta sadece haber olsun. Ayrıca haberi yazdıktan sonra içerikten yararlanarak aşağıdaki başlıkların bilgisi var ise haberin altında doldur. Eğer bilgi yoksa ilgili kısmı yazma.:
Subject of Research:
Article Title:
Article References:
Samarah, L.Z., Zheng, C., Xing, X. et al. Spatial metabolic gradients in the liver and small intestine.
Nature (2025). https://doi.org/10.1038/s41586-025-09616-5
Image Credits: AI Generated
DOI:
Keywords
Tags: energy generation in TCA cycleglutamate and malate measurement techniquesglutamine catabolism in liverglutamine synthetase activity in liverisotope tracing in metabolismisotope-labelled metabolite analysislactate and TCA cycle interactionsmetabolic flux in liver and intestinemetabolic gradients in liver and gutperiportal and pericentral metabolic processesspatial enzyme localization in mouse liverTCA cycle metabolites analysis