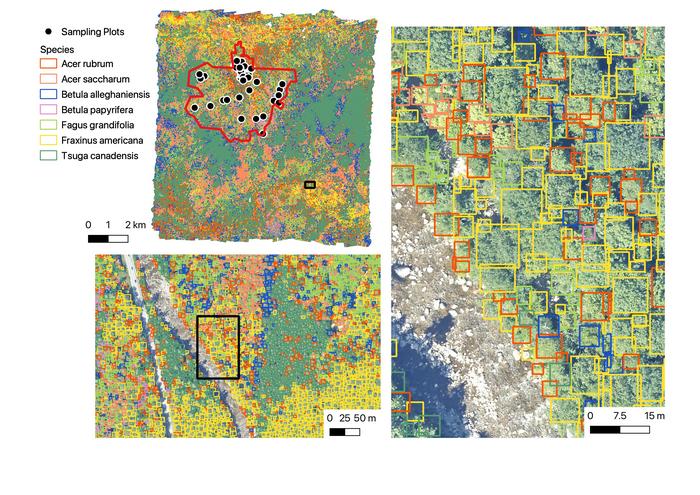
A collaborative team of researchers led by Ben Weinstein of the University of Florida, Oregon, US, used machine learning to generate highly detailed maps of over 100 million individual trees from 24 sites across the U.S., publishing their findings July 16th in the open-access journal PLOS Biology. These maps provide information about individual tree species and conditions, which can greatly aid conservation efforts and other ecological projects.

Credit: Weinstein BG, et al., 2024, PLOS Biology, CC-BY 4.0 (https://creativecommons.org/licenses/by/4.0/)
A collaborative team of researchers led by Ben Weinstein of the University of Florida, Oregon, US, used machine learning to generate highly detailed maps of over 100 million individual trees from 24 sites across the U.S., publishing their findings July 16th in the open-access journal PLOS Biology. These maps provide information about individual tree species and conditions, which can greatly aid conservation efforts and other ecological projects.
Ecologists have long collected data on tree species to better understand a forest’s unique ecosystem. Historically, this has been done by surveying small plots of land and extrapolating those findings, though this cannot account for the variability across the whole forest. Other methods can cover broader areas, but often struggle to categorize individual trees.
To generate large and highly detailed forest maps, the researchers trained a type of machine learning algorithm called a deep neural network using images of the tree canopy and other sensor data taken by plane. These training data covered 40,000 individual trees and, like all the data used in this study, were provided by the National Ecological Observatory Network.
The deep neural network was able to classify most common tree species with 75 to 85 percent accuracy. Additionally, the algorithm could also provide other important analyses, such as reporting which trees are alive or dead.
The researchers found that the deep neural network had the highest accuracy in areas with more open space in the tree canopy and performed best when categorizing conifer tree species, such as pines, cedars, and redwoods. The network also performed best in areas with lower species diversity. Understanding the strengths of the algorithm can be useful for applying these methods in a variety of forest ecosystems.
The researchers also uploaded their models’ predictions to Google Earth Engine so that their findings can aid other ecological research. The researchers add, “The diversity of overlapping datasets will foster richer areas of understanding for forest ecology and ecosystem functioning.”
The authors add, “Our aim is to provide researchers with the first broad scale maps of tree species diversity from ecosystems across the United States. These canopy tree maps can be updated with new data collected at each site. By collaborating with researchers across NEON sites we can build better and better predictions over time.”
#####
In your coverage, please use this URL to provide access to the freely available paper in PLOS Biology: http://journals.plos.org/plosbiology/article?id=10.1371/journal.pbio.3002700
Citation: Weinstein BG, Marconi S, Zare A, Bohlman SA, Singh A, Graves SJ, et al. (2024) Individual canopy tree species maps for the National Ecological Observatory Network. PLoS Biol 22(7): e3002700. https://doi.org/10.1371/journal.pbio.3002700
Author Countries: United States
Funding: see manuscript
Journal
PLoS Biology
DOI
10.1371/journal.pbio.3002700
Method of Research
Computational simulation/modeling
Subject of Research
Not applicable
COI Statement
Competing interests: The authors have declared that no competing interests exist.


