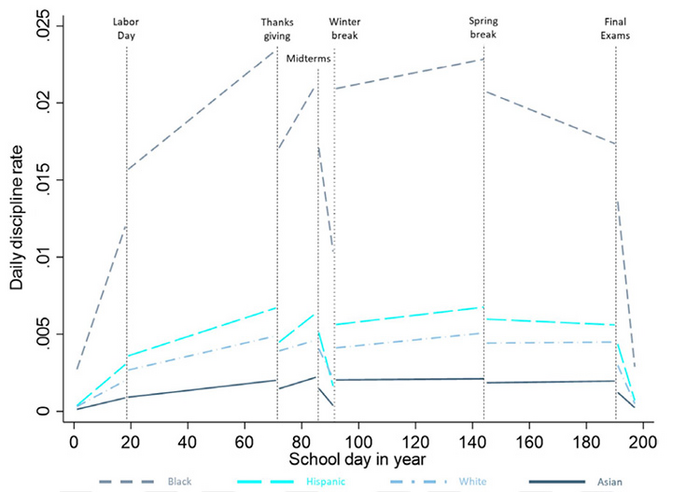
Berkeley — Rates of school discipline fluctuate widely and predictably throughout a school year and increase significantly faster for Black students than for their white counterparts, University of California, Berkeley, researchers have found.

Credit: Via PNAS article
Berkeley — Rates of school discipline fluctuate widely and predictably throughout a school year and increase significantly faster for Black students than for their white counterparts, University of California, Berkeley, researchers have found.
A new study published today in the journal Proceedings of the National Academy of Sciences documents for the first time the “dynamic” nature of student discipline during an academic year. Daily rates of punishment across all schools in the study ratchet up in the weeks before Thanksgiving break, decline immediately before major vacations and increase rapidly again when classes resume.
Schools with a high degree of racial disparity regarding discipline referrals or suspensions early in the year see discipline rates for Black students increase even faster as the semester continues, researchers found. By November, the Black student discipline rate is 10 times higher than at the beginning of the year. Compared to white students, it’s 50 times higher.
“This work is a game-changer,” said Jason Okonofua, assistant professor of psychology at UC Berkeley, and the study’s principal investigator. “We can predict year-long suspension rates in just the first 21 days of school. That’s information that we needed to know. And now we do.”
Okonofua and his colleagues used improved daily discipline-tracking technology to study the snapshots of middle school punishments. Going forward, the granular information they gleaned can help educators keep tabs on escalating school tension. It can even help teachers and school officials ward off potential discipline-causing incidents, much like they modify a lesson plan to overcome a learning gap in the classroom.
“The more information you have, the better decisions you can make,” Okonofua said. “If principals or teachers know by Halloween in any given year these students are facing this very heightened risk of being kicked out of school, or in which schools these students face the highest risk, we can get in there and do something about it, as opposed to letting it fester.
“Because the data shows, it would.”
Long the focus of federal inquiries, policy debate and scholarly interest, school discipline disparities have been well-documented nationwide. Recent research has shown that high school students who are suspended are more than twice as likely to be charged or convicted of a crime and incarcerated as young adults. Brief online coursework for teachers can even increase empathy and reduce suspensions. Yet, the debate is increasing about whether school officials should be quicker to kick students out of class.
While cycles of school tension might seem intuitive, the focus historically has not been on measuring punishment rates in real-time or introducing interventions before incidents occur.
Instead, districts collect data on student discipline and produce year-end reports for state and federal regulators to examine how discipline varies among schools, which ones are more punitive and where to target interventions. While that “static” data provides a summary of what’s gone on throughout the year, it fails to capture the day-to-day realities at school.
To understand this more “dynamic nature” of student discipline, Okonofua and his colleagues assembled four years of data about the daily disciplinary experiences of 46,964 students across 61 middle schools in one of the 10 largest school districts in the country. The district was located in a southern U.S. state and, like an increasing number of organizations, it had implemented a more sophisticated discipline data tracking system.
The results — especially the disparities — were immediately startling.
“It is incredibly important, useful and valuable to know we should do a specific type of intervention at a specific point in the year based on the real-time data. That’s where we’re going to get the biggest bang for our buck,” Okonofua said. “If we can be more cost-efficient, everybody wins.”
Okonofua’s co-authors — Sean Darling-Hammond of UCLA, Michael Ruiz of UC Berkeley and Jennifer L. Eberhardt of Stanford University — also published a short video that uses beeping tones to illustrate discipline disparities between Black and white students. The anxiety-inducing tones are meant to simulate how stressful school can be when students are witnessing increasing discipline.
Okonofua likened school discipline tracking tools to an athlete’s heart rate monitor at the gym. Rather than simply estimating how hard a workout was, real-time data can be more useful.
“The more data we have, the more we know,” Okonofua said. “And the more we know, the more we can do.”
The study shows how important it is for districts to create systems for teachers to regularly monitor school discipline, he said. Policy leaders should likewise take note as they write policies and dedicate funding meant to curb discipline, alleviate disparities and minimize disruption.
“It’s important to think about each data point. That’s a whole story,” said Okonofua, reflecting on discipline’s lasting effects on both the student in trouble and classmates witnessing the punishment. “I hope we can do as much as possible going forward to just keep in mind that each one of these data points is a whole life.”
Journal
Proceedings of the National Academy of Sciences
Subject of Research
People
Article Title
The dynamic nature of student discipline and discipline disparities
Article Publication Date
17-Apr-2023


