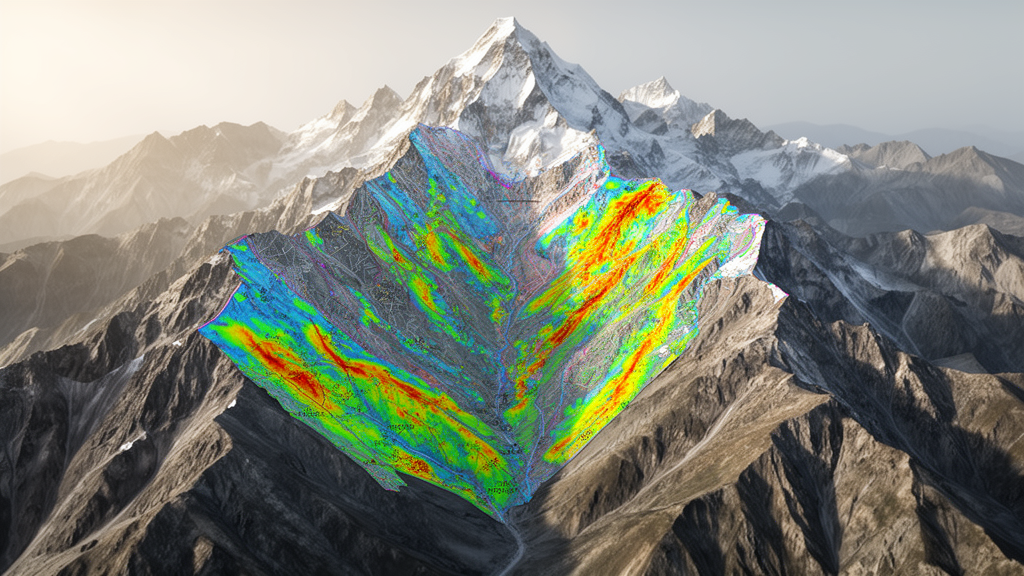
A rigorous comparative evaluation of geostatistical and heuristic modeling techniques across the high-relief terrain of Chamoli district in Uttarakhand, India, has established that the bivariate Frequency Ratio approach achieves significantly greater predictive performance than either the Analytical Hierarchy Process or Shannon Entropy. Investigating the complex spatial mechanisms that govern mass-movement phenomena within the seismically active Garhwal Himalayas, researchers applied all three distinct analytical frameworks across a standardized geographic information system environment at a thirty-meter grid resolution. The predictive validation, conducted by measuring the area under the receiver operating characteristic curve against an independent testing partition of historical failure coordinates, showed that the data-driven Frequency Ratio framework attained an area under the curve value of 0.819. In contrast, the expert-guided Analytical Hierarchy Process registered an accuracy metric of 0.789, while the information-theoretic Shannon Entropy model reached a notably lower discrimination capacity of 0.594. These findings demonstrate that empirical spatial correlations between documented slope failures and environmental conditioning layers can capture the non-linear realities of Himalayan mountain hazards more effectively than generalized entropy weighting or pure expert elicitation.
The study focused on the expansive, geologically volatile administrative region of Chamoli, which encompasses approximately 7,520 square kilometers of extremely rugged mountainous territory situated between latitudes 30.30 degrees to 31.30 degrees North and longitudes 79.20 degrees to 80.20 degrees East. Flanked by the surrounding Himalayan districts of Uttarkashi, Pithoragarh, Almora, Rudraprayag, and Tehri Garhwal, the district exhibits dramatic physiographic heterogeneity ranging from low-altitude river drainage basins and foothills to glaciated crests rising above 7,000 meters, including prominent peaks such as Nanda Devi, Trishul, and Kamet. Tectonic collision forces between the Indian and Eurasian plates have produced extensive faulting, folding, and structural shearing throughout the regional bedrock, leaving formations intensely fractured and predisposed to gravity-driven collapse. Furthermore, the local climatic system concentrates tremendous precipitation during the southwest monsoon between July and September, with intense rainfall events, cloudbursts, and rapid snowmelt frequently saturating mechanically weakened slopes. Historical episodes of catastrophic devastation, including the fatal debris flow and ice-rock avalanche that descended through the Rishi Ganga valley in 2021, emphasize the critical necessity for systematically validated spatial susceptibility zoning across this fragile environment.
To build an empirical foundation for susceptibility modeling, the authors compiled an extensive spatial inventory comprising 1,821 verified historical landslide occurrences using institutional data from the Geological Survey of India Bhukosh repository, supplemented by multi-temporal satellite detections from Landsat 5 and 9 platforms alongside targeted field ground-truthing. Analysts cross-referenced each observed failure zone against high-resolution Google Earth visualisations to confirm precise spatial coordinates and diagnostic morphological characteristics, including active tension cracks, displaced slope debris, headscarp scarps, bulging toes, grabens, and undrained surface depressions. In accordance with geostatistical consistency criteria, landslides with surface areas below 0.001 square kilometers—corresponding to approximately three to four pixels at the chosen spatial resolution—were excluded from downstream calculations. The final compiled catalogue captures typical high-relief Himalayan slope failures, prominently shallow debris slides, translational rockslides, and rapid rockfalls rooted within colluvial mantles, glaciogenic deposits, and highly weathered lithologies. The researchers then extracted centroid coordinate points from each delineating failure boundary and executed a stratified seventy-thirty random data division, setting aside 1,260 centroid locations for model training and reserving 561 distinct points strictly for model validation.
The research team assembled a comprehensive matrix of twenty-four geo-environmental and anthropogenic conditioning factors to capture the multidimensional forces driving slope instability across Chamoli. Topographic and morphometric determinants derived from digital elevation models included slope gradient, aspect distributed across ten distinct compass orientations, surface curvature, convergence index reflecting water and silt accumulation zones, and dissection index calculated as relative relief over absolute relief. Hydrological variables incorporated drainage density, stream power index signifying the erosive capacity of surface runoff, and the topographic wetness index indicating soil moisture distribution, alongside dedicated proximity buffer zones mapped at one-hundred-meter intervals from river networks. Geological layers sourced from official spatial records accounted for thirteen lithological units, alongside proximity buffers delineating distance to primary structural fault lines spaced at one-kilometer intervals and linear fracture lineaments spaced at one-hundred-meter intervals. The anthropogenic and vegetative dimensions were represented through slope length, relative relief, soil classification encompassing five mechanical categories, seismic magnitude density, land use and land cover classes, normalized difference vegetation index distributions, and precipitation levels interpolated from meteorological station records.
Anthropogenic landscape disturbance and environmental degradation were explicitly quantified through a multi-decadal satellite change detection analysis that compared Landsat normalized difference vegetation index metrics captured between 2008 and 2024. This longitudinal analysis categorized the district into stable vegetative cover, regenerating afforestation, and cleared deforestation zones, revealing that extensive forest loss strongly correlated with recent infrastructure expansion, such as major roadway widening projects and hydroelectric construction initiatives around settlements including Joshimath and Tapovan. Because uninhibited vegetation provides essential mechanical root reinforcement and stabilizes subsurface hydrological pathways, areas stripped of tree cover exhibited immediate vulnerability to slope failure. Road construction involving steep hillside excavations where natural slope angles exceed ten degrees similarly created chronic instability along transportation corridors. Before executing susceptibility algorithms, the researchers conducted rigorous multicollinearity screening across all twenty-four conditioning variables using variance inflation factor and tolerance diagnostic metrics. Every candidate factor satisfied the established safety criteria, exhibiting variance inflation factors well below the critical threshold of ten and tolerance values safely exceeding 0.10, thereby confirming statistical independence and ensuring no factor caused artificial redundancy.
The three investigative paradigms evaluated in the study approach spatial prediction from fundamentally distinct mathematical perspectives, illustrating key trade-offs between empirical association, physical uncertainty, and subjective domain expertise. The Frequency Ratio represents a bivariate statistical formulation that computes the exact numerical ratio between the percentage of documented landslide occurrences falling within a specific factor sub-interval and the overall territorial percentage occupied by that same sub-interval across the landscape. Sub-classes returning values above unity signal a disproportionately strong association with ground failure, whereas values below one denote minimal predictive correlation, allowing index integration by summing class scores across all factors. Conversely, the Shannon Entropy framework applies information theory to calculate system instability and randomness, deriving an objective weight for each environmental layer based on the probability density of landslide distribution across its sub-intervals, where factors demonstrating concentrated failure patterns receive higher informational importance. Meanwhile, the Analytical Hierarchy Process implements a structured multi-criteria decision framework that relies on expert elicitation, assembling pairwise comparison matrices scored along Saaty’s nine-point preference scale to calculate priority eigenvectors subject to a strict mathematical consistency ratio verification.
Spatial mapping results revealed striking differences in how the three models delineated hazard categories across Chamoli district when classified using the Jenks natural breaks optimization technique into very low, low, moderate, high, and very high susceptibility zones. The Frequency Ratio model established a balanced territorial distribution, allocating 7.14 percent of the district to very low susceptibility, 26.36 percent to low susceptibility, 32.74 percent to moderate susceptibility, 27.95 percent to high susceptibility, and 5.81 percent to the very high susceptibility category. In contrast, the Shannon Entropy model displayed a distinctly conservative spatial bias by assigning the vast majority of the landscape to higher-order hazard classifications, designating 40.47 percent as moderate, 32.04 percent as high, and 7.44 percent as very high susceptibility, while relegating merely 0.36 percent to the very low zone. The expert-driven Analytical Hierarchy Process produced a notably smoothed hazard profile that favored broader intermediate groupings, identifying 34.47 percent as moderate susceptibility, 34.37 percent as low susceptibility, and 29.72 percent as high susceptibility, while restricting its extreme categories to just 0.27 percent for very low and 1.17 percent for very high susceptibility.
Discrepancies in factor prioritization explain the spatial variations observed across the resulting susceptibility surfaces, highlighting critical divergences between purely statistical calculations and expert perception. Within the Shannon Entropy framework, forest cover change emerged as the most dominant governing variable with an entropy weight of 0.710, closely followed by geomorphology at 0.668, elevation at 0.321, land use land cover at 0.313, dissection index at 0.267, normalized difference vegetation index at 0.265, and geology at 0.223. Conversely, the Analytical Hierarchy Process assigned its highest single relative weight of six percent to bedrock geology, distributing five percent weights equally across twelve secondary factors including rainfall, slope gradient, soil type, earthquake density, and distances to roads, faults, and streams, while assigning four percent to remaining parameters. Intriguingly, while structural geology took precedence under expert ranking, it failed to rank among the top five influential factors within empirical statistical assessments. The authors suggest that because regional lithological formations across Chamoli, such as the Garhwal Group, are already broadly weathered and structurally sheared, lithological differentiation alone does not dictate localized slope failures as strongly as concentrated road excavation, steep slope gradients, or sudden vegetative clearing.
Comprehensive validation using receiver operating characteristic curve analysis confirmed that the Frequency Ratio model provided the most dependable predictive performance when evaluated against the independent 561-point testing dataset. Its achieved area under the curve score of 0.819 demonstrated high discriminatory capability, successfully identifying complex slope failure clusters concentrated tightly along excavated road corridors, undercut riverbanks, and deforested slopes. Although the Analytical Hierarchy Process scored lower at 0.789, it maintained strong qualitative utility by offering transparent, easily interpretable factor weightings that reflect widely accepted geological engineering principles. The notably inferior performance of Shannon Entropy, which achieved an area under the curve of only 0.594, revealed serious vulnerabilities in applying uniform entropy assumptions across highly heterogeneous mountain environments. Because Shannon Entropy presumes that conditioning variables operate independently and provide linearly informative weightings based on class frequencies, it failed to capture the intricate, non-linear physical interactions that trigger mass movements amidst fractured topography, leading to overgeneralized hazard zones that dilute practical utility for local civil protection authorities.
While confirming the efficacy of bivariate statistical modeling for regional planning, the researchers emphasize that their framework functions as an analytical proof-of-concept rather than an operational real-time early warning system. Because the current methodology relies on retrospective inventory evaluations and static thirty-meter environmental layers, it cannot dynamically capture rapid moisture fluctuations or localized slope deformations without incorporating finer-scale spatial data from platforms like Sentinel-2, airborne LiDAR, or unmanned aerial vehicle surveys. Furthermore, the authors caution that spatial transferability across other geologically vulnerable Himalayan regions requires prospective operational testing and the eventual assimilation of dynamic rainfall triggering thresholds, antecedent precipitation indices, and advanced machine learning architectures like Random Forest or Support Vector Machines. Nevertheless, the generated Frequency Ratio cartography delivers immediate, evidence-based guidance for infrastructure planning and disaster mitigation agencies across Chamoli district. By delineating critical high-risk sectors clustered along transportation lifelines and populated river valleys, the findings provide engineering departments with actionable spatial targets for implementing bio-engineering stabilization, targeted hillside afforestation, and proactive land-use zoning.
Subject of Research: Comparative assessment of heuristic and statistical landslide susceptibility models in Chamoli district, Uttarakhand
Article Title: Comparative assessment of landslide susceptibility using heuristic and statistical models in Chamoli, Uttarakhand, India
Article References: Kunwar, S., Khali, H., Kumar, H., Deep, A., Mishra, N., Meer, M. S., & Das, J. (2026). Comparative assessment of landslide susceptibility using heuristic and statistical models in Chamoli, Uttarakhand, India. International Journal of Geo-Engineering, 17(1), Article 31. https://doi.org/10.1186/s40703-026-00287-3
Image Credits: AI Generated
DOI: 10.1186/s40703-026-00287-3
Keywords: Landslide Susceptibility Mapping, Chamoli District, Frequency Ratio, Shannon Entropy, Analytical Hierarchy Process, Uttarakhand, Garhwal Himalayas, Receiver Operating Characteristic, Geographic Information Systems, Remote Sensing, Disaster Risk Reduction, Geomorphology, Slope Instability, Forest Cover Change, Infrastructure Development, Multicollinearity Analysis
News Source: Denise Maddox. (November 20, 2026). Frequency Ratio Model Outperforms Competing Methods for Himalayan Landslide Susceptibility Mapping. Scienmag.