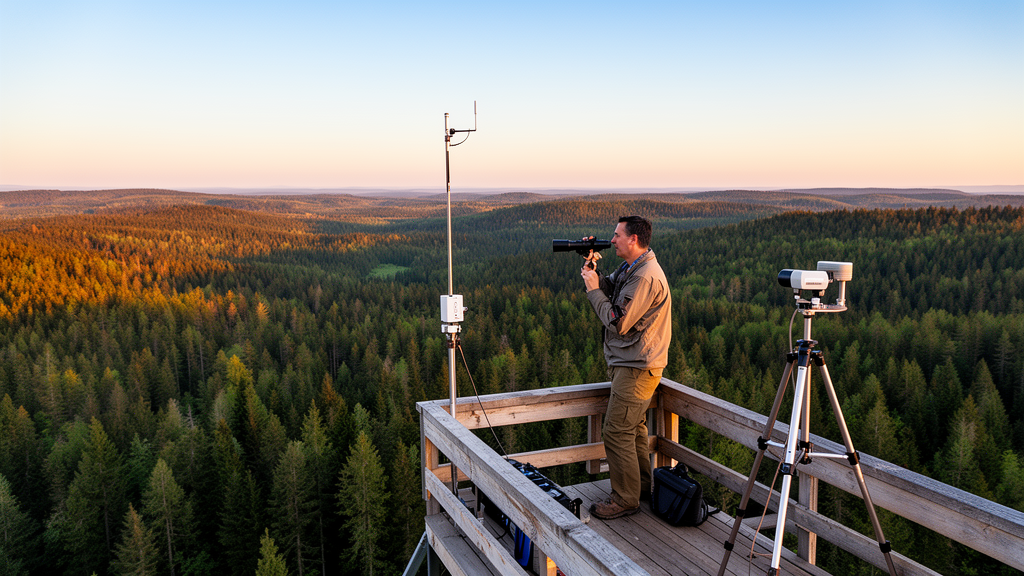
Forest aboveground biomass density serves as a fundamental descriptor of forest structure and terrestrial carbon storage, playing a central role in ecosystem monitoring, disturbance assessment, restoration planning, and carbon-cycle research. While field inventories yield direct and locally interpretable measurements of forest structure, their substantial logistical costs and sparse spatial coverage restrict repeated wall-to-wall assessments across large or heterogeneous landscapes. To extend sparse reference measurements across entire regions, environmental scientists increasingly integrate satellite imagery and spaceborne lidar observations. The Global Ecosystem Dynamics Investigation provides footprint-level, model-derived aboveground biomass density estimates accompanied by explicit quality flags and prediction standard errors. Meanwhile, the Sentinel-2 mission delivers multispectral and red-edge surface reflectance related to vegetative vigor, Sentinel-1 supplies C-band synthetic aperture radar backscatter responsive to moisture and physical canopy geometry, and complementary terrain and canopy-height datasets introduce structural and topoclimatic context. However, synthesizing these multi-source data streams requires researchers to navigate complex sequences of temporal compositing, spatial scaling, quality filtering, predictor construction, sampling, model fitting, and validation.
Although cloud platforms like Google Earth Engine combine extensive Earth observation catalogs with scalable server-side computational power, accessible processing alone does not guarantee scientific reproducibility. Subtle choices regarding clear-pixel screening thresholds, temporal composite reducers, predictor transformations, lidar quality screening, terrain slope limits, random data partitioning, and machine learning hyperparameters can alter the modeling sample and diverge resulting predictive performance. To resolve these ambiguities, researcher Hamdi A. Zurqani developed ForestAGBD-GEE version 1.0, an open-source, configuration-driven modeling framework published in SoftwareX. ForestAGBD-GEE formalizes a multi-source modeling approach originally demonstrated at Green Tree Reservoir in Arkansas into a modular, reusable architecture. By consolidating analytical decisions into a single centralized configuration object and standardizing data processing pipelines within the Earth Engine JavaScript Code Editor, the software enables researchers to conduct controlled methodological experiments and trace how specific analytical settings influence continuous biomass predictions across forested landscapes.
At the core of the ForestAGBD-GEE architecture is a modular processing workflow designed to eliminate hidden analytical dependencies and ensure that individual parameters can be systematically modified while holding all other experimental factors constant. The centralized configuration object governs all aspects of an experiment, including the geographic region of interest, analysis dates, optical masking, temporal compositing reducers, digital elevation model sources, spaceborne lidar filtering rules, predictor group selections, regression models, cross-validation parameters, random number seeds, and output export specifications. Executing entirely within the cloud environment, the workflow requires no proprietary desktop geographic information systems software or local compilation. The repository supplies the primary Earth Engine script, user guide documentation, reference benchmark metrics, and an illustrative configuration approximating the Green Tree Reservoir extent, allowing researchers to evaluate alternative modeling strategies without restructuring underlying processing code.
The data ingestion and preprocessing stage transforms heterogeneous satellite catalogs into an analysis-ready predictor stack paired with quality-screened lidar reference data. Optical predictors are derived from harmonized Sentinel-2 surface reflectance, where digital numbers are scaled by 0.0001 prior to index calculation. Cloud Score+ quality assessment bands screen out degraded pixels using a default clear-pixel threshold of 0.50, and retained cloud-free observations across the defined analysis window are aggregated using a median temporal reducer. The workflow implements ten discrete Sentinel-2 spectral bands, spanning visible, red-edge, near-infrared, and shortwave-infrared wavelengths, alongside fifteen spectral indices including NDVI, EVI, NDRE, GNDVI, and specialized vegetation indices. Radar predictors are generated from Sentinel-1 Ground Range Detected imagery, providing calibrated backscatter in decibels across vertical-vertical and vertical-horizontal polarizations. Radar indices defined as power ratios or normalized combinations are evaluated in linear-power space, with an optional decibel formulation maintained for specific experimental requirements. Topographic elevation and slope are integrated from either the 1-meter bare-earth USGS 3DEP elevation model or the global 30-meter Copernicus DEM, complemented by high-resolution canopy-height layers from Meta and the World Resources Institute.
To assemble a reliable calibration and testing sample, the workflow subjects footprint observations from the monthly GEDI L4A raster collection to a sequential series of quality-control filters. Observations are retained only when the primary quality flag equals 1 and the degrade flag equals 0. Subsequently, the algorithm evaluates relative prediction uncertainty, defined as the ratio of biomass density standard error to estimated biomass density, excluding footprints where this ratio exceeds 0.50 under default settings. Because steep topography can distort footprint waveforms and impair biomass retrieval accuracy, the system incorporates an optional terrain-slope filter with an explicit angular default threshold of 16.699 degrees, representing a 30 percent grade. Predictor values from the aligned optical, radar, terrain, and structural layers are then sampled at the spatial locations of surviving lidar footprints to construct a standardized tabular regression dataset, recording the final observation count and retained feature names to ensure full analytical traceability.
Model training and evaluation are conducted through four implemented regression algorithms: Random Forest, Classification and Regression Trees, Support Vector Regression, and Gradient Tree Boosting. The regression table is partitioned reproducibly into training and holdout subsets using a fixed random seed, adopting a default 70 percent training and 30 percent holdout split. Within the training partition, the software supports configurable k-fold cross-validation to compare hyperparameter options and predictor sets without compromising the untouched status of the holdout data. ForestAGBD-GEE treats root mean square error as the primary metric for model selection, reporting the coefficient of determination, mean absolute error, and sample size across all scored partitions. The default Random Forest implementation initializes with 120 trees, seven variables per split, a minimum leaf population of five, a bag fraction of 0.60, and a maximum tree depth of 50 nodes. After hyperparameter optimization, the finalized model is refitted across the training set, evaluated against the holdout partition, and applied across the full predictor composite to generate a continuous biomass raster alongside diagnostic metric summaries and variable-importance profiles.
The utility and comparative performance of the framework are demonstrated through an illustrative application in the 2184.3-hectare Green Tree Reservoir, a forested wetland landscape situated in the Lower Mississippi Alluvial Valley of Arkansas. In this baseline analysis over calendar year 2021, quality filtering retained 308 GEDI L4A footprint observations. Evaluating nine distinct predictor combinations across the four regression algorithms revealed substantial variations in predictive accuracy and spatial extrapolation patterns. Gradient Tree Boosting achieved the highest overall performance, yielding a coefficient of determination of 0.77, a root mean square error of 37.78 megagrams per hectare, and a mean absolute error of 22.27 megagrams per hectare when combining Sentinel-2 bands, vegetation indices, topographic derivatives, and canopy height. Random Forest followed closely with an R² of 0.74, an RMSE of 39.93 megagrams per hectare, and an MAE of 31.34 megagrams per hectare under the same predictor suite, while Classification and Regression Trees achieved an R² of 0.68 and an RMSE of 39.97 megagrams per hectare. Conversely, Support Vector Regression produced an R² of 0.37 and an RMSE of 73.48 megagrams per hectare, a result attributed to unscaled input features possessing heterogeneous physical units and an untuned radial basis function kernel.
Mapped continuous predictions across Green Tree Reservoir highlighted notable differences in model behavior across landscape features. Spatial prediction ranges varied substantially among the fitted algorithms, spanning 61.18 to 308.7 megagrams per hectare for Random Forest, 53.66 to 339.0 megagrams per hectare for Classification and Regression Trees, 26.52 to 357.0 megagrams per hectare for Gradient Tree Boosting, and 59.87 to 217.4 megagrams per hectare for Support Vector Regression. These mapped ranges emphasize that spatial biomass distributions depend heavily on model structure, input feature selection, and filtering thresholds. By exposing these interacting factors within a single reproducible environment, ForestAGBD-GEE allows researchers to systematically diagnose whether differences in continuous biomass maps arise from true ecological variations or specific computational processing decisions.
Despite its structured analytical capabilities, the workflow operates within specific scientific limitations inherent to satellite-based forest characterization. Foremost, GEDI L4A biomass density values represent footprint-scale model estimates carrying inherent calibration uncertainties rather than direct, error-free field measurements; consequently, regression models calibrated against them inevitably inherit these reference uncertainties. Agreement with withheld GEDI observations quantifies statistical consistency with lidar-modeled estimates rather than ground-truth accuracy. Furthermore, conventional random 70/30 data partitioning does not guarantee spatial independence among calibration and validation samples, as geographically proximate footprints may share local environmental and canopy conditions, potentially inflating reported validation metrics. Studies prioritizing regional transferability require spatial blocking, leave-area-out validation, or independent ground-plot measurements to evaluate extrapolation performance rigorously.
Additional operational constraints stem from discrepancies in native spatial resolutions, temporal coverage, and acquisition geometries among optical, radar, terrain, and canopy-height datasets. While Google Earth Engine harmonizes these layers into common export projections and cell sizes, resampling does not eliminate physical scale mismatches or guarantee independent information at fine spatial grains. Furthermore, the workflow reports global validation statistics rather than propagating input noise into per-pixel prediction intervals, requiring outputs to be interpreted strictly as model-based spatial estimates rather than definitive inventory data. Long-term computational reproducibility also remains linked to the persistent availability of public Earth Engine data collections and external project assets. Nevertheless, by formalizing transparent filtering rules, modular predictor pipelines, and standardized evaluation protocols under an open MIT License, ForestAGBD-GEE establishes an accessible and rigorous foundation for academic research, technical training workshops, and methodological comparisons in forest biomass mapping.
Subject of Research: Reproducible multi-sensor forest aboveground biomass density estimation using Google Earth Engine
Article Title: ForestAGBD-GEE: reproducible multi-source forest aboveground biomass density modeling in Google Earth Engine
Article References: Zurqani, H. A. (2026). ForestAGBD-GEE: reproducible multi-source forest aboveground biomass density modeling in Google Earth Engine. SoftwareX, 36, Article 103193. https://doi.org/10.1016/j.softx.2026.103193
Image Credits: AI Generated
DOI: 10.1016/j.softx.2026.103193
Keywords: Google Earth Engine, aboveground biomass density, ForestAGBD-GEE, GEDI, Sentinel-2, Sentinel-1, remote sensing, machine learning, random forest, gradient tree boosting, carbon monitoring, spatial modeling, forestry, cloud computing, synthetic aperture radar, canopy height
News Source: Denise Maddox. (November 13, 2026). Google Earth Engine Workflow Standardizes Multi-Source Forest Biomass Modeling and Evaluation. Scienmag.