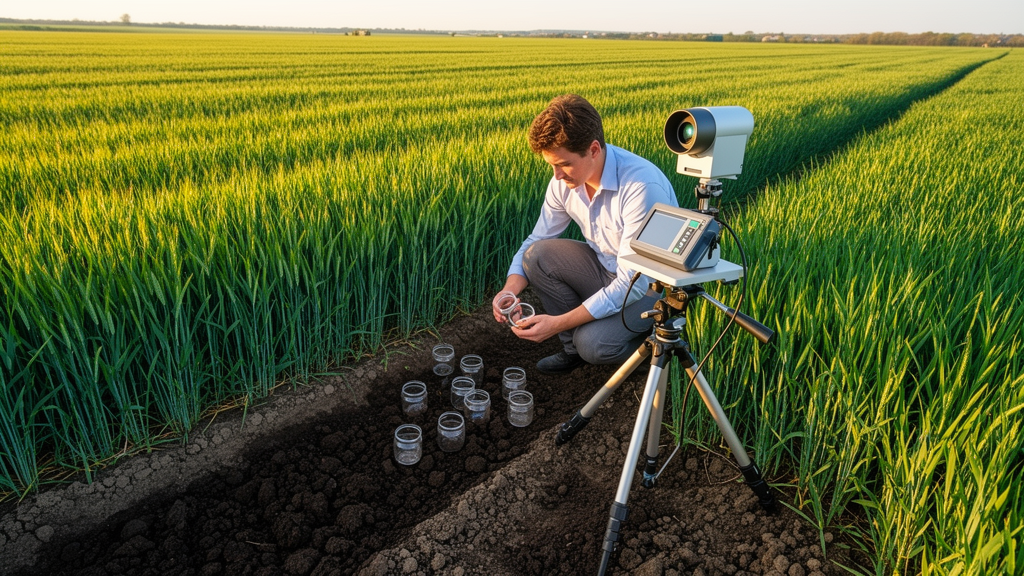
Field screening of agricultural land for essential micronutrients has long confronted a persistent operational bottleneck: standard laboratory chemical assays provide precise ground truth but remain slow, costly, and destructive, making exhaustive testing across extensive field parcels impractical. In a field study conducted in Wuhe County within Anhui Province, China, agricultural engineering researchers developed and evaluated an investigator-designed order-aware spectral neural network framework named OS-GAMI-CNN to screen selenium-related wheat plots using proximal canopy reflectance. By integrating interpretable additive band responses, order-restricted pairwise band interactions, and multiscale one-dimensional sequence convolutions, the model categorizes wheat plots into soil-associated selenium tiers without attempting direct chemical quantification. Evaluated under a rigorous strict-protocol leave-one-plot-out cross-validation framework across eight held-out field plots, the reference neural architecture achieved a balanced accuracy of 0.868 and a receiver operating characteristic area under the curve of 0.913, demonstrating that canopy-scale optical proxies can triage candidate acreage and concentrate subsequent laboratory assays on the most decision-critical agricultural locations.
Selenium represents an essential trace element vital for human dietary nutrition, prompting agricultural regions worldwide to identify and cultivate naturally enriched soils to support specialized functional crop production and regional food branding initiatives. Nevertheless, measurement remains the bottleneck because reliable selenium determination depends on laboratory chemical assays that are destructive, labor-intensive, costly, and too slow for rapid screening over many plots. Because laboratory determination demands destructive chemical extraction and specialized instrumentation, researchers sought a rapid proximal sensing methodology capable of ranking candidate plots, guiding low-cost ground surveys, and filtering unpromising fields before executing expensive chemical confirmations. Rather than serving as an end-stage analytical measurement tool, proximal field spectroscopy bridges the practical gap between plot-scale observations and definitive laboratory assays by creating an efficient triage mechanism that helps agronomists establish ground-reference spectral libraries and direct limited analytical budgets toward fields requiring verification.
The optical mechanism governing spectral selenium screening is inherently indirect and functions as statistical proxy modeling rather than direct optical detection. In plant tissues, selenium occurs predominantly as inorganic selenate or selenite during root uptake and transforms into organic selenium compounds following biochemical assimilation, maintaining tissue concentrations far below the detection threshold of major plant optical absorbers. Across the 400 to 2500 nanometer reflectance range, canopy selenium does not produce an isolated diagnostic absorption band. Instead, any subtle spectral response associated with selenium status is masked by dominant optical signals originating from leaf chlorophyll, moisture, cellular protein, cellulose, canopy architecture, and underlying soil background reflectance. Consequently, the predictive capacity of canopy spectroscopy relies on statistical associations between soil selenium availability and integrated plant conditions, wherein crop vigor, normalized-difference vegetation index characteristics, water balance, soil organic matter, mineral composition, and iron or manganese oxide variability collectively contribute to measurable variations in canopy reflectance.
To investigate this proxy relationship under operational conditions, the research team conducted a coordinated proximal spectroscopy survey covering Xiaoxi and Zhuding towns in Wuhe County between 09:30 and 16:00 on May 5, 2026, coinciding with the critical wheat grain-filling stage. Working under clear-sky illumination centered around solar noon, operators collected canopy spectra using an ASD FieldSpec4 HR-NG spectroradiometer spanning 350 to 2500 nanometers at a 1 nanometer sampling interval. The measurement protocol positioned the optical probe vertically approximately two centimeters above the upper wheat canopy leaves, recording ten successive reflectance curves per sampling point to eliminate anomalous measurements and generate point-level mean reflectance spectra. The field campaign sampled ten distinct wheat plots yielding 303 point-level spectra, ranging from 15 to 53 points per plot, linked to associated soil selenium concentrations spanning from 0.087 to 1.064 milligrams per kilogram across the study area coordinate grid.
A critical technical contribution of the study lies in addressing spatial data leakage and field-support label ambiguity, which frequently distort machine learning evaluations in precision agriculture. Because individual agricultural fields contain dozens of highly autocorrelated canopy spectra, conventional random spectrum-level splits leak field identity between training and testing sets, yielding artificially inflated performance estimates that fail when deployed across new parcels. Furthermore, real-world field conditions introduce spatial offsets between soil sampling coordinates and crop canopy measurements. To evaluate these dependencies, the researchers established three complementary protocol scenarios: an original protocol encompassing all 303 spectra across ten plots; a reviewed protocol that reclassified boundary plot 1 and excluded plot 4 due to documented road-construction disturbance, heterogeneous crop cover, and a 97-meter spatial offset; and a strict protocol that completely excluded both ambiguous plots 1 and 4, retaining 236 spectra across eight plots comprising 38 low-selenium points from plots 5 and 9 and 198 high-selenium points from six plots.
Spectral preprocessing eliminated atmospheric interference regions from the raw 350 to 2500 nanometer profiles by masking intervals between 760 and 780 nanometers, 1350 and 1400 nanometers, 1850 and 1940 nanometers, and 2250 and 2350 nanometers. Focusing specifically on the visible and near-infrared range below 1000 nanometers to target leaf pigments, red-edge transitions, and canopy structural properties, the workflow retained 629 modeling wavelengths spanning 350 to 759 nanometers and 781 to 999 nanometers. Within each leave-one-plot-out validation fold, the retained reflectance sequences were standardized strictly using training-fold statistics, supplemented by a first-derivative channel computed across the sequence to capture spectral curvature. To supply the structured model with a compact representation that avoids overfitting small field cohorts, the visible and near-infrared range was partitioned into ten contiguous ordered wavelength bands whose interval means preserved physical wavelength ordering.
The OS-GAMI-CNN architecture was structured specifically to exploit the ordered physical nature of spectral data, departing from standard tabular neural networks that treat input features as arbitrarily permutable variables. The model decomposes the prediction logit into three additive pathways: an additive main-effect branch containing ten small multilayer perceptrons that model nonlinear individual band responses; an order-aware pairwise interaction branch constrained strictly to lower-to-higher wavelength combinations; and a multiscale one-dimensional convolutional branch utilizing kernel widths of 9, 31, and 63 to extract localized spectral shape features. The pairwise branch evaluates 28 candidate pairs spanning adjacent bands, two-hop intervals, visible-to-red-edge transitions, and wide-span anchor bands, with each interaction regulated by a distance-decay prior and a learned sparsity gate. This structured formulation reduced the model parameter footprint by 20.4 percent compared to an unconstrained all-pairs configuration, maintaining 10,108 parameters while embedding physical sequence constraints directly into the network architecture.
Under the strict leave-one-plot-out validation protocol, OS-GAMI-CNN demonstrated balanced screening accuracy across held-out plots, recording an overall accuracy of 0.886, a balanced accuracy of 0.868, a low-selenium recall of 0.842, a high-selenium recall of 0.894, and an area under the curve of 0.913, with a Brier calibration score of 0.104. In comparative evaluations against standard spectral machine learning baselines, partial least squares discriminant analysis fitted on the ten ordered bands served as the strongest traditional comparator, achieving an identical low-selenium recall of 0.842 and a comparable area under the curve of 0.911, but yielding lower high-selenium recall at 0.828 and a balanced accuracy of 0.835. Other standard classifiers demonstrated reduced transferability when evaluated across held-out plots, with a radial basis support vector machine attaining 0.749 balanced accuracy, XGBoost recording 0.708, and random forest yielding 0.671, while standard vegetation index logistic regression using normalized difference and red-edge indices registered 0.717.
Post-hoc model inspection and controlled ablations clarified the physical patterns learned by the neural framework alongside its deployment utility. Examination of centered main-effect curves revealed that elevated reflectance across visible bands B2 through B6 consistently reduced the high-selenium prediction logit, matching empirical observations that low-selenium canopies exhibited brighter visible reflectance signatures between 350 and 700 nanometers. Furthermore, the strongest learned neural interactions concentrated in adjacent spectral intervals, specifically bands B7–B8 spanning 739 to 869 nanometers, B4–B5 spanning 545 to 675 nanometers, and B3–B4 spanning 480 to 610 nanometers. Controlled multi-seed experiments across random seeds 7, 17, and 27 confirmed robust stability, producing mean balanced accuracy of 0.839 and an area under the curve of 0.895, while deployment simulations demonstrated that prioritizing the top 30 percent of model-ranked canopy points successfully retrieved 86.8 percent of all low-selenium points, offering substantial efficiency gains for targeted laboratory assay allocation.
Despite these encouraging validation results, the authors emphasized significant research limitations arising from the small geographic and temporal scope of the dataset. The field campaign relied on only ten total plots from a single county surveyed on one measurement date, leaving only eight plots in the strict protocol, of which merely two represented the low-selenium class. Consequently, during leave-one-plot-out cross-validation, withholding either low-selenium plot left only a single low-class exemplar to train the classifier, creating heightened sensitivity to field identity and resulting in broad paired bootstrap confidence intervals that overlapped with competitive baselines. The researchers concluded that while OS-GAMI-CNN provides an interpretable and effective ground-reference triage framework for proximal field sensing, broad operational deployment will require expanded, multi-temporal field campaigns across diverse soil types, wheat cultivars, and management regimes, coupled with co-registered plant physiological measurements to disentangle indirect agronomic growth factors from true soil geochemical signatures.
Subject of Research: Order-aware proximal hyperspectral screening of selenium-associated wheat plots
Article Title: Order-aware proximal spectral screening of selenium-related wheat plots with OS-GAMI-CNN
Article References: Liu, L., Wang, B., Gao, K., & Li, J. (2026). Order-aware proximal spectral screening of selenium-related wheat plots with OS-GAMI-CNN. Smart Agricultural Technology, 15, Article 102704. https://doi.org/10.1016/j.atech.2026.102704
Image Credits: AI Generated
DOI: 10.1016/j.atech.2026.102704
Keywords: proximal sensing, hyperspectral imaging, wheat canopy reflectance, selenium screening, precision agriculture, OS-GAMI-CNN, agricultural technology, soil selenium, leave-one-plot-out, Wuhe County, spectral preprocessing, vegetation indices, field spectroscopy, chemometrics, partial least squares discriminant analysis, machine learning in agriculture, crop triage, canopy optical properties
News Source: Alan Morgan. (November 13, 2026). Spectral Model Screens Soil Selenium Categories in Wuhe County Wheat Plots. Scienmag.