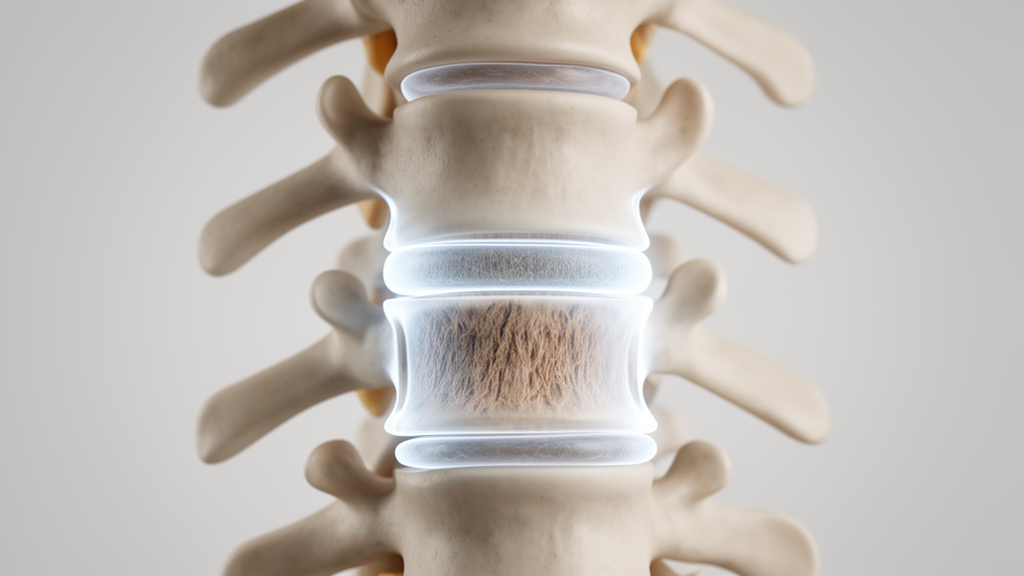
A narrative review published in the Egyptian Journal of Radiology and Nuclear Medicine synthesizes evidence demonstrating that quantitative T2 relaxation time mapping can detect early biochemical alterations in lumbar intervertebral disc degeneration before structural damage appears on conventional magnetic resonance imaging. Conventional imaging techniques assess spine pathology primarily through qualitative visual inspection, which often fails to identify the molecular cascade that precedes disc height reduction, annular tearing, and chronic pain. By tracking the decay of transverse magnetization across tissue water protons, T2 mapping provides a non-invasive, physiologically grounded measurement of the disc’s internal biochemical microenvironment.
Low back pain represents one of the most pervasive musculoskeletal disorders globally, generating extensive healthcare costs and chronic disability. A substantial proportion of these clinical presentations stems from pathological deterioration within the lumbar intervertebral discs, a multifactorial cascade involving dynamic cellular, biochemical, and biomechanical disturbances. In healthy adults, the central nucleus pulposus functions as a viscoelastic, highly hydrated structure composed of seventy to ninety percent water by weight. This gelatinous core is anchored within an extracellular matrix rich in type II collagen and large proteoglycans, predominantly aggrecan. Aggrecan molecules possess dense arrays of negatively charged glycosaminoglycan side chains, specifically chondroitin sulphate and keratan sulphate, which generate significant osmotic swelling pressure. This osmotic force attracts and retains water molecules, providing the disc with the internal hydraulic cushion necessary to distribute mechanical spinal loads evenly across adjacent vertebral bodies.
The degenerative sequence begins biochemically when native nucleus pulposus cells upregulate catabolic enzymes, notably matrix metalloproteinases and a disintegrin and metalloproteinase with thrombospondin motifs. These active enzymes degrade proteoglycan core proteins and cleave glycosaminoglycan side chains, directly diminishing the tissue’s osmotic swelling pressure and intrinsic water-binding capacity. As dehydration takes hold, the disorganized matrix loses its viscoelastic resistance to compressive forces, initiating a destructive biomechanical cycle that progressively damages the surrounding multi-lamellar annulus fibrosus and cartilaginous endplates. Standard diagnostic workflows rely primarily on conventional sagittal T2-weighted MRI interpreted through semi-quantitative classification tools like the five-tier Pfirrmann grading scale. While Pfirrmann scoring grades discs according to visible signal intensity, internal homogeneity, disc height loss, and the visual distinction between the nucleus and annulus, it remains a subjective visual interpretation. This subjective nature introduces considerable inter-observer and intra-observer variability, particularly across early Pfirrmann grades I through III where signal loss is subtle.
To evaluate the scientific literature addressing these diagnostic blind spots, the authors executed a structured, reproducible literature search across PubMed/MEDLINE, Scopus, Web of Science, and Google Scholar through April 2025, adhering to the Scale for the Assessment of Narrative Review guidelines. The search utilized combinations of Medical Subject Headings and free-text terms including T2 mapping, intervertebral disc degeneration, lumbar spine, quantitative MRI, and nucleus pulposus. Eligible studies comprised human clinical investigations and validated ex vivo or animal models published in peer-reviewed English-language journals that reported disc-region-specific T2 values across at least twenty disc evaluations. Studies addressing only cervical or thoracic segments were excluded, along with letters and abstracts lacking complete data. Because the included literature exhibited widespread methodological heterogeneity in scanner field strengths, pulse sequence parameters, region-of-interest delineation, and reported outcome measures, the authors compiled a structured narrative synthesis rather than a formal meta-analysis.
The physical principle of T2 mapping relies on measuring the transverse relaxation time, which quantifies the precise rate at which transverse magnetization decays following a radiofrequency excitation pulse. In biological disc tissue, this relaxation rate reflects the molecular mobility of protons located within tissue water. Free water molecules exhibit rapid, unrestricted isotropic motion that diminishes dipole-dipole interactions, thereby prolonging T2 relaxation times, whereas water molecules bound to dense, anisotropic collagen fibers experience augmented dipolar coupling that markedly accelerates signal decay. In a healthy nucleus pulposus, abundant free water and an isotropic collagen mesh yield characteristically prolonged T2 values, typically ranging between 80 and 120 milliseconds on 3.0 Tesla MRI systems. As enzymatic degradation depletes proteoglycans and reduces hydration, nucleus pulposus T2 values shorten progressively. Conversely, in the annulus fibrosus, which possesses high baseline collagen density and low water content, baseline T2 times are naturally shorter, though degeneration can induce paradoxical T2 prolongations due to the disruption of organized collagen architecture.
Acquiring quantitative T2 data within clinical practice fundamentally transforms subjective image contrast into absolute, scanner-independent numerical values through mathematical modeling. The decay of transverse signal intensity across the nucleus pulposus conforms to a mono-exponential decay equation expressed as signal intensity at echo time equal to initial signal amplitude multiplied by the mathematical constant e raised to the negative ratio of echo time to T2. By acquiring multiple images across incremental echo times, specialized software computes a pixel-by-pixel curve fit, generating a color-coded parametric map wherein each voxel directly represents local transverse relaxation times in milliseconds. The standard clinical sequence utilized for this measurement is the two-dimensional multi-echo spin-echo sequence, which acquires multiple echoes following a single excitation repetition. This multi-echo strategy minimizes confounding signal distortions caused by longitudinal T1 relaxation recovery between pulses and supplies adequate data points to fit robust mono-exponential curves across both healthy and degenerated spinal segments.
A critical body of evidence synthesized in the review demonstrates a consistent inverse correlation between quantitative nucleus pulposus T2 relaxation times and established Pfirrmann visual grades. Multiple investigated cohorts confirm that T2 values decline progressively and significantly from Pfirrmann grade I through grade IV. In a prospective single-center study by Stefanou and colleagues analyzing 185 lumbar discs from 37 patients on a 3.0 Tesla MRI scanner, analysis of variance and Tukey post-hoc tests revealed statistically significant differences in T2 relaxation values across every pairwise Pfirrmann grade comparison. Crucially, quantitative relaxometry reliably differentiated between Pfirrmann grade II and grade III discs, a specific boundary where subjective human interpretation frequently falters. Furthermore, investigations by Stelzeneder and colleagues across 300 lumbar discs in 60 subjects established that receiver operating characteristic curves can define cut-off values for objective binary classification of degenerative status, providing an empirical standard that independent patient cohorts have corroborated on both 1.5 Tesla and 3.0 Tesla scanners.
Beyond morphological grading, published experimental studies establish direct biochemical validation for T2 relaxometry against laboratory reference standards. In an ex vivo investigation conducted at 9.0 Tesla by Paul and colleagues utilizing a caprine lumbar disc model, researchers compared T2, T1-rho, and apparent diffusion coefficient mapping against histological scoring, biomechanical recovery curves, and quantitative assays of glycosaminoglycan and water content. Following selective enzymatic depletion of proteoglycans, nucleus pulposus T2 relaxation values exhibited immediate, statistically significant reductions that mirrored glycosaminoglycan loss. Complementing these laboratory observations, clinical studies by Patel and colleagues confirmed that nucleus pulposus T2 values correlate closely with tissue hydration and proteoglycan concentrations, whereas annulus fibrosus measurements reflect changes in collagen fiber anisotropy. Additionally, clinical research from Tianjin University involving 66 patients demonstrated that quantitative disc T2 values not only aligned with Pfirrmann and Rajasekaran degenerative grades but also correlated moderately with clinical low back pain symptom severity scores.
The review also evaluates how T2 relaxometry compares against competing quantitative techniques, specifically T1-rho mapping and gradient-echo T2* mapping. T1-rho mapping measures spin-lattice relaxation in the rotating frame and exhibits heightened physical sensitivity to the slow macromolecular motions characteristic of proteoglycan-water interactions. In comparative clinical trials by Yang and colleagues evaluating 195 discs in 39 subjects, T1-rho and T2 values correlated strongly with correlation coefficients exceeding 0.80. For early degeneration categorized as Pfirrmann grades II to III, T2 mapping demonstrated superior diagnostic accuracy under receiver operating characteristic curve analysis compared to T1-rho, while both modalities outperformed T2* mapping. While T1-rho demonstrates superior sensitivity to pure proteoglycan changes in controlled animal models, it requires specialized high-energy radiofrequency spin-lock pulses unavailable on standard clinical machines, leaving T2 mapping as the more accessible modality for widespread hospital deployment.
Historically, a primary obstacle impeding routine clinical adoption of T2 mapping has been the excessive scanning duration required by traditional multi-echo spin-echo sequences, which typically require ten to fifteen minutes per patient. Recent engineering advances have resolved this bottleneck through accelerated imaging sequences. Specifically, investigators have validated GRAPPATINI, a sequence that combines k-space undersampling with parallel imaging and model-based iterative reconstruction algorithms. Rotta and colleagues demonstrated that GRAPPATINI reduces examination times from thirteen minutes and eighteen seconds down to two minutes and twenty-seven seconds while maintaining statistically comparable T2 measurements. Subsequent validation by Schwarz and colleagues in 58 subjects established that accelerated GRAPPATINI protocols accurately separated normal discs from those presenting bulging or herniation, proving that high-fidelity quantitative relaxometry can be seamlessly integrated into high-volume clinical spine imaging workflows without extending patient appointment times.
Despite these technological improvements, several methodological limitations must be resolved before quantitative relaxometry can enter standardized diagnostic practice. Published literature remains constrained by small sample sizes, varying region-of-interest delineation methods, and significant protocol discrepancies between institutions. Reported T2 values fluctuate based on magnetic field strength, radiofrequency coil designs, echo spacing, and the subjective placement of segmentation boundaries, as manual region-of-interest tracing by less experienced observers introduces measurement variability. Furthermore, while the normative T2 relaxation range for healthy nucleus pulposus tissue at 3.0 Tesla is broadly accepted as 80 to 120 milliseconds, inter-scanner variations alter baseline thresholds. Establishing multi-center standardization initiatives, physical phantom calibration protocols, and age- and sex-stratified normative databases across spinal levels represents an essential prerequisite for reproducible multi-site diagnostic deployment.
The synthesis concludes that emerging artificial intelligence and deep-learning segmentation algorithms offer promising solutions to overcome observer variability by standardizing automated boundary delineation across the nucleus pulposus and annulus fibrosus. Looking forward, the review emphasizes the need for large-scale prospective longitudinal studies to determine whether baseline T2 relaxation values can predict long-term functional disability, clinical symptom progression, and patient response to biological therapies. Because T2 mapping reliably detects the early biochemical prodrome of disc degeneration long before permanent structural collapse occurs, it establishes a crucial diagnostic window. This capability positions quantitative T2 relaxometry to serve as an indispensable, objective imaging endpoint for monitoring regenerative spine treatments, including intradiscal growth factor administration, platelet-rich plasma therapy, mesenchymal stem cell injections, and gene therapy interventions.
Subject of Research: Quantitative T2 mapping magnetic resonance imaging for early detection of lumbar intervertebral disc degeneration
Article Title: Role of T2 mapping MRI in early lumbar intervertebral disc degeneration: a narrative review
Article References: Jeeva, M., Sundararajan, S., Hari Baskar, S., Prem Kumar, G., Ragitha, R., Dinesh, S., & Deepika, A. (2026). Role of T2 mapping MRI in early lumbar intervertebral disc degeneration: a narrative review. Egyptian Journal of Radiology and Nuclear Medicine, 57(1), Article 191. https://doi.org/10.1186/s43055-026-01855-4
Image Credits: AI Generated
DOI: 10.1186/s43055-026-01855-4
Keywords: T2 mapping, quantitative MRI, lumbar intervertebral disc degeneration, nucleus pulposus, annulus fibrosus, proteoglycans, aggrecan, glycosaminoglycans, Pfirrmann grading, transverse relaxation time, T1-rho mapping, T2* mapping, GRAPPATINI, multi-echo spin-echo, low back pain, biochemical imaging biomarkers, musculoskeletal radiology
News Source: Ophelia Keating. (November 13, 2026). Quantitative T2 Mapping MRI Detects Early Degenerative Disc Changes Before Structural Failure. Scienmag.