Published in Fire Ecology, the brief report demonstrates how readily measured vegetation variables can be crosswalked to the fuel models required by computer simulations of wildfire behavior. This approach addresses a critical gap in proactive wildfire management, where the vast and remote nature of the western United States makes manual fuel mapping challenging, particularly in mixed woody and herbaceous vegetation.
The study focused on the fire-prone sagebrush steppe of the Great Basin, where the displacement of fire-intolerant perennial communities by fire-promoting exotic annual grasses has altered wildfire regimes. Computer-model simulations of wildfire behavior are essential for designing and implementing fuels treatments, yet available models require detailed maps of fire behavior fuel models that are difficult to create for complex vegetation mixes. The authors aimed to bridge this gap by relating fire behavior fuel model assignments from 3,700 recently burned and unburned plots to plant cover estimated using three distinct field and remote sensing techniques.
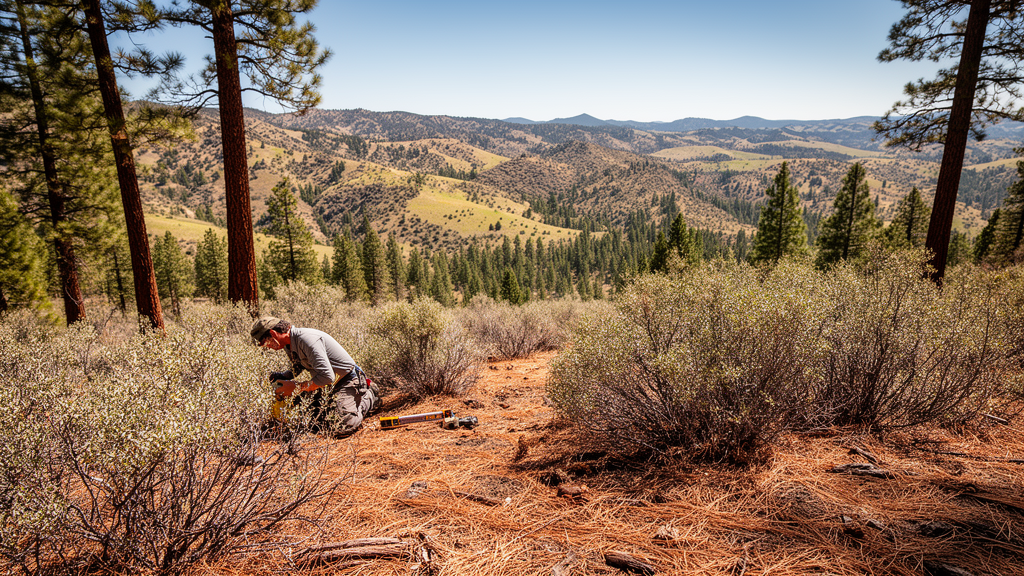
The research team, led by Cara Applestein and colleagues, utilized data from thirteen focal landscapes sampled during the growing seasons from 2020 to 2023. Vegetation cover was measured using line-point intercept transects, grid-point intercept from high-resolution aerial photos, and ocular estimation over 13-meter radius areas. Each plot was assigned a fire behavior fuel model based on the Scott and Burgan fuel library, using either direct field identification or classification from landscape photographs. This dataset provided a robust foundation for testing how different cover estimation methods influence the accuracy of fuel model predictions.
To model the relationship between vegetation cover and fuel models, the researchers employed random forest algorithms, a machine learning technique well-suited for prediction and variable importance assessment. The data was split into training and testing sets, with model parameters optimized to maximize predictive accuracy. The random forest models predicted fuel model classification from field-derived vegetation functional group cover, including exotic annual grasses, large-statured perennial grasses, short-statured perennial grasses, bare ground, herbaceous litter, shrubs, and trees. Latitude and longitude were also included to account for potential spatial autocorrelation in the fuel model distributions.
The results indicated that the accuracy of the fuel model predictions varied significantly depending on the cover estimation method used. The ocular estimation method yielded the highest kappa statistic of 0.57 and an accuracy of 0.66, likely due to the larger plot size which better matched the scale of fuel model assessment. In contrast, the line-point intercept method achieved a kappa of 0.40 and accuracy of 0.75, while the grid-point intercept method resulted in a kappa of 0.34 and accuracy of 0.65. These findings suggest that the scale and resolution of cover measurement are critical factors in determining the reliability of automated fuel model mapping.
Shrub cover emerged as the most important variable for determining fuel model classification in both the line-point intercept and ocular estimation methods. For the line-point intercept data, plots with less than 8% shrub cover tended to be classified as short, sparse dry climate grass, whereas plots with 8% or more shrub cover were classified as low load dry climate shrub or low load dry climate grass/shrub, depending on the cover of short-statured perennial grass. This threshold of 7 to 10% shrub cover was consistent across all three measurement types, marking a distinct boundary between grass-dominated and woody-dominated fuel types.
The grid-point intercept method revealed more complex relationships, with multiple combinations of cover variables defining specific fuel types. For instance, short, sparse dry climate grass was characterized by either high bare ground cover with low large-statured perennial grass, or moderate large-statured perennial grass with low shrub cover. The method also highlighted the importance of bare ground as a proxy for total community cover, as the proportional cover values in grid-point intercept sum to unity, creating a negative correlation with grass and shrub cover. This distinction underscores the need to include estimation technique in fuel model mapping algorithms to account for methodological differences.
One of the key findings was the one-to-many relationship between fuel models and plant type blends. Individual grass fuel models could be comprised of very different combinations of large-statured perennial grasses, exotic annual grasses, or litter cover, all of which differ markedly in their fire characteristics. This variability implies that a single fuel model classification may mask significant differences in fuel bed composition and potential fire behavior. The random forest-informed decision trees provided a rule-based framework for selecting fuel models from vegetation cover, offering a transparent and interpretable alternative to black-box machine learning predictions.
The study also identified limitations in the current fuel model libraries and mapping approaches. There was also a scale mismatch between the functional group cover data and the fuel model data, as fuel models were assessed over a wider area than the specific cover measurement techniques. These limitations highlight the need for more diverse and extensive data collection to improve the generalizability of fuel model mapping methods.
The developed method provides an initial quantitative framework for classifying fuel models from historic and contemporary cover data, enabling fire simulation modeling on sagebrush steppe landscapes. By leveraging existing vegetation monitoring data, such as that from the Bureau of Land Management Assessment, Inventory and Monitoring program, this approach can facilitate the creation of accurate fuel maps for large wildland areas. The authors note that while the current method relies on qualitative fuel model assignments, the random forest approach allows for automated mapping from standard vegetation abundance maps, potentially refining existing products like LANDFIRE.
Future improvements in wildfire risk modeling will likely involve the development of physics-based models that can incorporate field metrics more directly, reducing the reliance on predefined fuel model libraries. However, until such models become operational, the quantitative crosswalk between plant cover and fuel models presented in this study offers a valuable tool for strategic prioritization of land management efforts. The ability to map fuel models from readily available cover data supports more efficient and effective management of exotic plant invasions and altered wildfire regimes in the western United States.
The research underscores the importance of integrating quantitative methods into fuel mapping practices to enhance the accuracy of wildfire simulations. By revealing the thresholds and relationships between plant cover and fuel types, the study provides a foundation for developing more robust and scalable fuel mapping tools. As the pressure to manage landscape wildfire risks increases, such empirical methods will be critical for informing the design and implementation of proactive fuels treatments in remote and vast ecosystems.
The study’s reliance on recently burned sites introduces specific constraints on the resulting fuel model predictions. The line-point intercept and grid-point intercept datasets were drawn exclusively from areas between two and ten years post-fire, whereas the ocular estimation data from Craters of the Moon included both recently burned and unburned plots. This post-fire focus limited the variability in fuel conditions, particularly for shrub and mixed shrub-grass types, which were poorly represented in the training data. The authors note that more data across a variety of unburned fuel types is needed to assess more generalizable patterns, as the limited coverage of these intercept methods may not make them ideal for determining large plot-scale fuel models.
A significant methodological challenge involved aligning the spatial scale of vegetation cover measurements with the scale of fuel model assessment. For the line-point intercept and grid-point intercept methods, a scale mismatch existed because fuel models were assessed within the entire view of perspective photographs, with vegetation visible out to a radius of approximately 20 meters. In contrast, line-point intercept assessed only two-dimensional transects, and grid-point intercept considered areas of only six square meters. The ocular estimation method avoided this mismatch by conducting cover estimates for a 13-meter radius circular plot, with fuel model assessment performed within the same area. This alignment likely contributed to the higher kappa statistic observed for the ocular method, as the measurement scale better matched the fuel model assessment scale.
The inability of the grid-point intercept and ocular models to define the low load, dry climate shrub fuel type was a notable finding, given the simplicity of that classification. This fuel type is characterized by sparse and patchy shrub cover, which may be difficult to capture with the limited spatial coverage of the grid-point intercept method. The authors suggested that collecting additional metrics, such as shrub size and density, could help define this cover type in future studies. The strong predictive power of bare ground in the grid-point intercept model, but not the line-point intercept model, further highlights the distinct statistical properties of these methods. In grid-point intercept, proportional cover values sum to unity, making bare ground a proxy for total community cover, whereas in line-point intercept, multiple canopy layers are recorded, allowing cover values to exceed 100 percent.
The random forest models included latitude and longitude as predictors to account for potential spatial autocorrelation in fuel model distributions. This variable was more important for characterizing fuel models within the line-point intercept data because the spatial distribution of these plots was much more dispersed across many sites in different states. In the line-point intercept dataset, nearby plots were often part of the same wildfire, while further plots were located at different wildfires.
Subject of Research: Quantitative mapping of fire behavior fuel models from vegetation cover data in sagebrush steppe
Article Title: A quantitative, empirical method for generating fuel-bed maps from plant cover estimates reveals thresholds and one-to-many fuel-to-plant type relationships
Article References: Applestein, C., Price, S. J., & Germino, M. J. (2026). A quantitative, empirical method for generating fuel-bed maps from plant cover estimates reveals thresholds and one-to-many fuel-to-plant type relationships. Fire Ecology, 22(1), Article 134. https://doi.org/10.1186/s42408-026-00539-8
Image Credits: AI Generated
DOI: 10.1186/s42408-026-00539-8
Keywords: wildfire, fuel models, sagebrush steppe, vegetation cover, machine learning, fire ecology, landscape management, remote sensing, quantitative, empirical, method, generating
News Source: Drew Townsend. (November 10, 2026). Plant Cover Data Maps Wildfire Fuel Models. Scienmag.