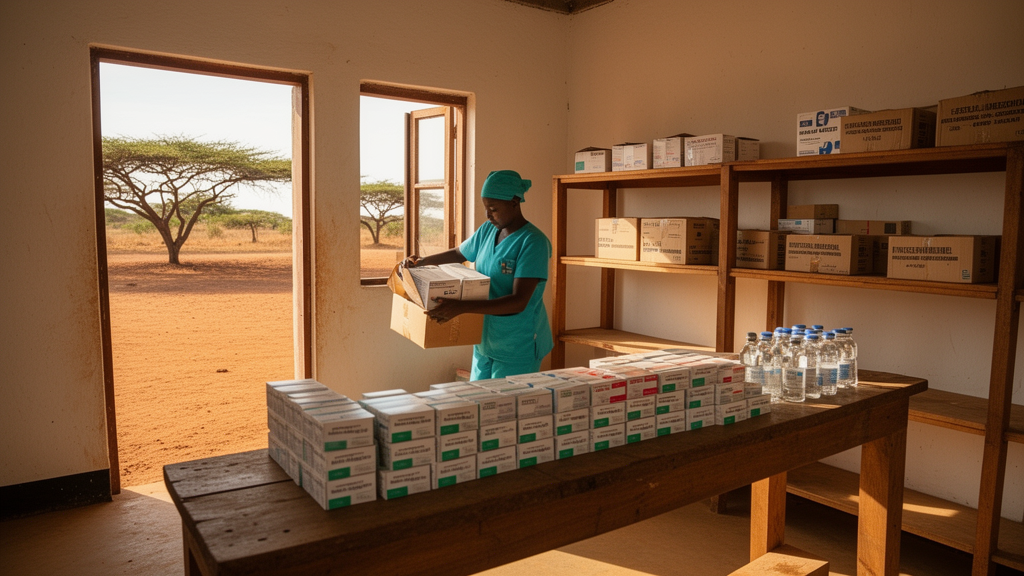
A comprehensive policy evaluation from Tanzania has demonstrated that incorporating service delivery indicators alongside demographic and equity factors into a national capitation model explains more than seventy percent of the variation in facility-level health commodity expenditures. Historically, health financing devolution across many low- and middle-income countries has relied on pure population counts or unadjusted historical allocations, creating systemic mismatches between assigned funds and actual clinical supply requirements. To address persistent disparities across public facilities, researchers and health ministry officials evaluated an evidence-based resource allocation formula designed to distribute central government pharmaceutical funds among primary, secondary, and tertiary health delivery tiers. By analyzing retrospective utilization and expenditure figures from the national District Health Information System, investigators found that a structured multi-variable model accounted for seventy-seven percent of per capita commodity expenditure variation across primary health care units, including dispensaries, health centres, and district hospitals, while explaining seventy-four percent across health centres and district hospitals evaluated separately.
The structural context of Tanzania’s public healthcare architecture provided the foundation for reforming central commodity funding flows. Approximately seventy percent of all health facilities nationwide are publicly owned, with dispensaries, health centres, and district hospitals comprising eighty-seven percent of the country’s health infrastructure under the decentralization framework overseen by the Prime Minister’s Office Regional Administration and Local Government alongside Local Government Authorities. Although district hospitals are administratively designated within the primary care sphere in domestic terminology, they deliver clinical packages encompassing surgical procedures, inpatient admissions, and comprehensive obstetric care that align functionally with secondary care standards. Secondary and tertiary tiers, which include regional referral hospitals, zonal facilities, specialized centres, and the national hospital, operate under direct Ministry of Health oversight. Central financing involves monthly disbursements from the Ministry of Finance to facility-specific accounts maintained at the Medical Stores Department, which fulfills bi-monthly medicine deliveries directly to registered clinics.
To establish a transparent and methodologically sound allocation framework, researchers implemented a collaborative six-phase development process grounded in health economics literature and local policy constraints. The initial desk review analyzed thirty-four peer-reviewed and grey literature documents, identifying twenty-two relevant studies examining formula funding, risk adjustments, and pharmaceutical demand determinants in resource-constrained environments. Drawing upon established public finance frameworks and empirical models from Uganda, Malawi, and Mozambique, researchers extracted fourteen candidate predictors and five core evaluation criteria: feasibility and administrative cost, consistency and verifiability through routine reporting, resistance to fraudulent manipulation, predictive validity regarding service expenditures, and operational transparency. These selection criteria guided preliminary consultations between the Ministry of Health and local government officials, establishing an objective baseline for shortlisting variables that reflected both clinical necessity and administrative feasibility across decentralized local councils.
Stakeholder engagement culminated in a structured three-day workshop that convened twenty purposively selected participants representing the Ministry of Health, local government authorities, the National Bureau of Statistics, and hospital administrations. Workshop participants reviewed the documented shortcomings of the preexisting allocation model, which distributed sixty percent of commodity funding to dispensaries and health centres based primarily on council populations with fixed fifteen percent weightings for poverty and under-five mortality, but allocated facility-level shares purely on catchment headcount. From an initial pool of eighteen proposed risk adjusters, attendees shortlisted eight operational variables for formal statistical evaluation. The shortlisted factors comprised catchment population, poverty indices, under-five mortality rates, and specific clinical activity indicators consisting of outpatient department attendances, antenatal care visits, normal facility deliveries, inpatient admissions, and caesarean section surgical procedures recorded in the national health database.
Empirical modeling evaluated the predictive performance of proposed variables across a diagnostic sample of eighty dispensaries, forty-eight health centres, twenty district hospitals, and ten regional referral hospitals that completed the national 2021/2022 financial needs assessment. Researchers conducted Pearson correlation assessments and estimated log-log ordinary least squares multiple regression equations to evaluate joint explanatory capacity and elasticity relationships. Bivariate analyses confirmed statistically significant positive correlations (p < 0.01) exceeding 0.70 between per capita commodity expenditure and all five service delivery measures, with antenatal visits showing moderate association. Diagnostic tests verified model specification, yielding Breusch-Pagan test results confirming homoscedasticity across models and variance inflation factor scores below ten. While high inter-variable correlation among service volume metrics inflated individual coefficient standard errors, overall joint explanatory power remained strong, justifying variable retention on theoretical and operational grounds rather than mechanical statistical filtering.
Model sensitivity analyses confirmed that log-log functional specifications outperformed linear models by stabilizing residual variance and accommodating positive skewness in facility spending data. Log-transformed equations produced higher coefficients of determination, reaching 0.774 in primary health care facilities compared to 0.761 under linear estimation, and 0.741 versus 0.705 in health centre and district hospital models. Furthermore, linear models violated diagnostic assumptions regarding residual normality and homoscedasticity. Although an alternative stepwise specification isolating catchment population and antenatal attendances produced a marginally higher adjusted R-squared value of 0.708 relative to 0.700 in the comprehensive health centre and district hospital cohort, investigators retained the complete service delivery bundle. Because inpatient admissions and major surgeries represent major resource-consuming clinical activities, omitting them would implicitly assign zero funding weight to essential inpatient care, compromising operational credibility and policy alignment.
Translating these empirical findings into actionable administrative formulas required a multi-tiered weighting framework balancing demographic volume, socioeconomic vulnerability, and direct service workload. For primary health care allocations from the central ministry to councils, stakeholder consensus reduced the catchment population weighting from seventy percent to sixty percent, raising the combined equity allocation to forty percent to support national strategic goals of eliminating healthcare disparities. Rather than maintaining static fifteen percent allocations for poverty and under-five mortality, researchers implemented a multiplicative, data-driven mathematical formula that distributed the forty percent equity envelope dynamically across councils according to composite vulnerability indices. Within individual councils, the distribution of funds to specific dispensaries and health centres shifted substantially, reducing pure population weight from one hundred percent to forty percent while dedicating sixty percent of resources to facility-specific clinical activity volumes.
Hospital financing rules were similarly revised to replace historical bed-capacity metrics with workload-driven criteria across secondary and tertiary administrative tiers. Under the overarching allocation envelope, thirty percent of national commodity financing continues to fund hospital services, with forty-five percent allocated to district hospitals, thirty percent to regional referral facilities, fifteen percent to zonal and national centres, and ten percent reserved for specialized hospitals. For regional referral hospitals, stakeholder consensus established a formula allocating sixty percent to catchment population, twenty percent to district poverty indices, and twenty percent to recorded utilization divided between inpatient admissions at fifteen percent and outpatient visits at five percent. Specialized hospitals were disaggregated into two distinct categories: institutions with documented self-funding capacity were grouped with zonal facilities and funded via outpatient and inpatient workloads weighted at thirty and seventy percent, respectively, while dedicated psychiatric and infectious disease institutions received equal baseline allocations.
To evaluate the practical consequences of these formula adjustments, researchers conducted scenario testing using an illustrative funding envelope of fifty billion Tanzanian shillings, equivalent to 21.8 million United States dollars. The comparative analysis demonstrated that transitioning to data-driven equity weighting expanded commodity funding to highly deprived areas, yielding a sixty-four percent increase for Council Five relative to historical formulas. At the institutional level, service adjustments redirected financing toward facilities experiencing heavy clinical demand irrespective of official catchment boundaries. For example, District Hospital Five, situated in an urban council serving large migrant populations from outside its catchment perimeter, saw its commodity allocation expand by one hundred and thirty-eight percent. Conversely, Health Centre Two and District Hospital Four experienced reductions of twenty-seven percent and thirty-four percent, respectively, reflecting low recorded patient throughput despite expansive territorial populations.
While this multi-tier allocation architecture advances resource allocation methods within sub-Saharan Africa, investigators underscored critical methodological constraints and practical governance requirements. Routine administrative data derived from facility reporting systems can present variability in documentation quality, although national results-based financing initiatives have progressively reinforced data audit rigor. The researchers explicitly noted that cross-sectional regression models establish empirical correlation and predictive validity rather than direct causal relationships, meaning that formulas require ongoing prospective validation against observed procurement budgets and physical commodity stock availability over three-year administrative revision cycles. Balancing clinical utilization metrics against baseline population equity remains essential to prevent reinforcing supply-induced demand. Nevertheless, systematic documentation of stakeholder consensus, econometric diagnostics, and multi-tier administrative implementation provides an evidence-based roadmap for health commodity financing across data-constrained health systems.
Subject of Research: Evaluation and design of an evidence-based health commodity resource allocation formula in Tanzania
Article Title: Health commodity resource allocation formula to achieve universal health coverage in Tanzania: a policy perspective
Article References: Ngalesoni, F. N., Ruhago, G. M., Mutatina, A. W., Katani, E. M., Kengia, J. T., Mushi, A. A., Msasi, D. I., & Tukai, M. A. (2026). Health commodity resource allocation formula to achieve universal health coverage in Tanzania: a policy perspective. Cost Effectiveness and Resource Allocation, 24(1), Article 132. https://doi.org/10.1186/s12962-026-00800-6
Image Credits: AI Generated
DOI: 10.1186/s12962-026-00800-6
Keywords: Health Commodity Allocation, Capitation Formula Funding, Tanzania Health System, Universal Health Coverage, Pharmaceutical Expenditure, Primary Health Care, District Health Information System, Risk Adjustment, Service Utilization, Health Financing Equity, Resource Allocation Formula, Health Policy Reform, Public Health Facilities, Medical Stores Department, Health Economics
News Source: Blake Davidson. (November 10, 2026). Data-Driven Allocation Formula Explains Health Commodity Expenditure Patterns Across Tanzanian Clinics. Scienmag.