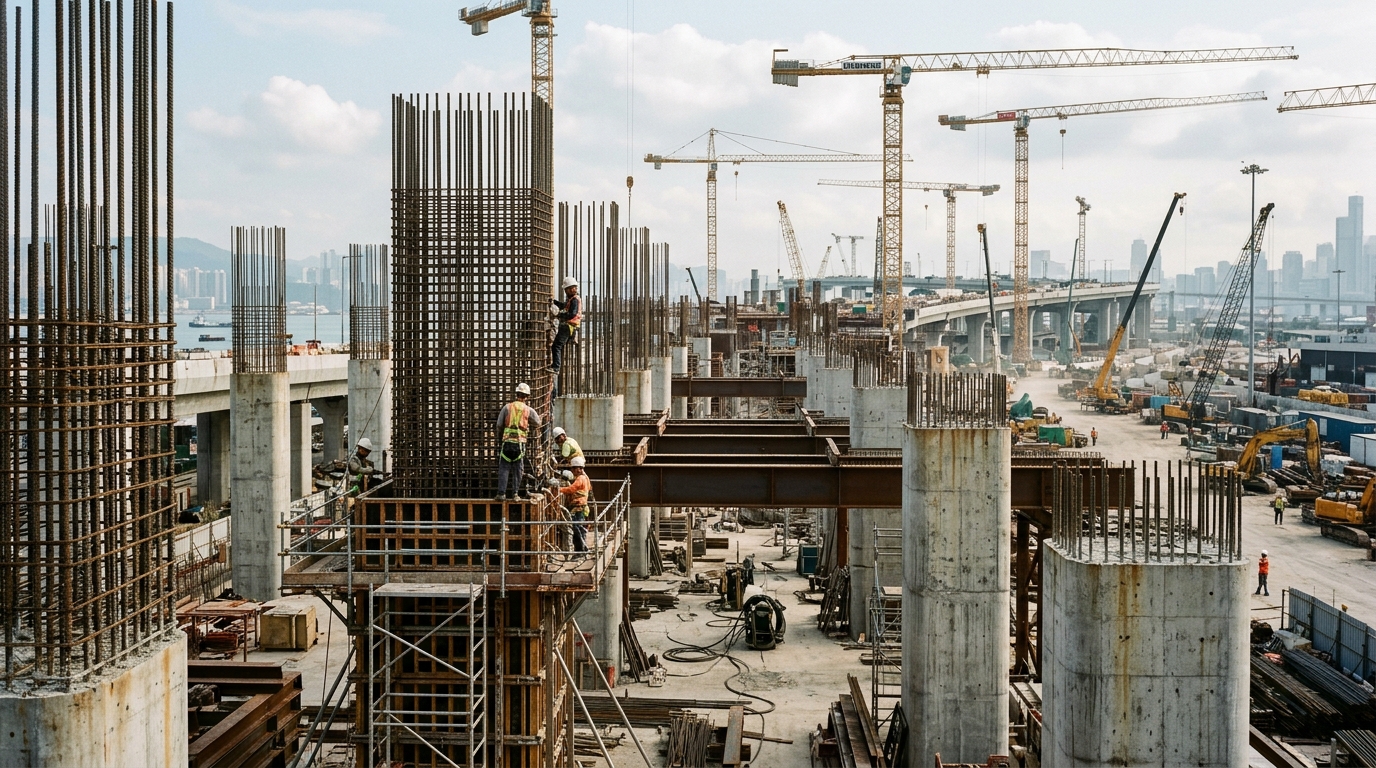
Global embodied carbon dioxide emissions driven by construction activities reached a peak of 4.86 gigatonnes in 2013 before plateauing and decreasing slightly to 4.49 gigatonnes in 2021, when they accounted for 13.6 percent of total worldwide emissions. These findings emerge from a comprehensive multi-decade assessment conducted across 189 countries from 2000 to 2021 to evaluate the scale, origins, and structural drivers of supply-chain emissions generated by construction demand.
Prior evaluations of construction-related supply-chain emissions were frequently limited to single nations, narrow time windows, or conflicting accounting boundaries, leaving the redistribution of embodied emissions across domestic and international trade networks unresolved. To establish globally comparable evidence, the investigators integrated an environmentally extended multi-regional input–output framework with structural decomposition analysis, creating a coherent global accounting benchmark for construction-driven embodied carbon flows.
The spatiotemporal analysis demonstrated that the geographic distribution of emission burdens relocated progressively toward developing economies over the 21-year study window, with China responsible for the primary share of this transition. Concurrently, embodied emission intensities across economies generally decreased and regional disparities narrowed, even as international trade reshaped the global landscape by establishing developing nations as the predominant destinations for construction-associated emission flows.
Through structural decomposition analysis, the authors identified final demand expansion as the overriding catalyst behind the overall rise in emissions, contributing a 175.1 percent increase. This demand-driven surge substantially surpassed the counteracting mitigation achieved through energy-intensity reductions, which contributed a 66.1 percent reduction, production-structure adjustments, which yielded a 16.3 percent decrease, and process-emission-intensity improvements, which provided an 8.1 percent reduction.
Beyond tracking supply-chain dynamics, the researchers compared construction-driven embodied carbon dioxide emissions with operational energy emissions across participating economies and evaluated existing policy instruments designed to mitigate embodied carbon. Drawing directly on these comparative insights and structural dynamics, the authors formulated differentiated avoid-shift-improve mitigation portfolios tailored to guide region-specific decarbonization strategies across major economic groups.
Subject of Research: Global construction-driven embodied carbon dioxide emissions and structural drivers
Article Title: Global construction-driven embodied CO2 emissions: spatiotemporal dynamics and underlying drivers
Article References: Zhu, C., Xu, F., & Li, X. (2026). Global construction-driven embodied CO2 emissions: spatiotemporal dynamics and underlying drivers. Journal of Industrial Ecology. https://doi.org/10.1007/s44498-026-00204-y
Image Credits: AI Generated
DOI: 10.1007/s44498-026-00204-y
Keywords: embodied carbon, construction emissions, supply chains, structural decomposition analysis, environmental input-output, decarbonization, industrial ecology, global emissions, Global, construction-driven, embodied, emissions
News Source: Denise Maddox. (November 7, 2026). Global Construction Embodied Emissions Peaked in 2013 Driven by Final Demand. Scienmag.